
This post is excerpted from Forest2Market's monthly Economic Outlook, a 24-month forecast of macroeconomic indicators.
Industrial Production
Industrial production (IP) rose by 0.7% in March after a 1.2% advance in February. The report showed:
- Manufacturing increased by 0.5%, slowing from February’s +1.4%.
- Wood Products jumped by 2.5%, more than offsetting February’s -1.2%.
- Paper advanced 1.1%, reversing some of February’s -1.9%.
- Construction edged up by 0.2%, notably slower than February’s +1.0%.
- Consumer Goods increased by 0.7%, a little better than half February’s rate of +1.3%.
Capacity utilization of all industries increased by 0.5% (to 79.2%). Wood Products advanced by 2.2% while Paper rose by 1.2%. Capacity among all industries expanded by 0.2%; Wood Products increased by 0.3% while Paper shrank by 0.1%.
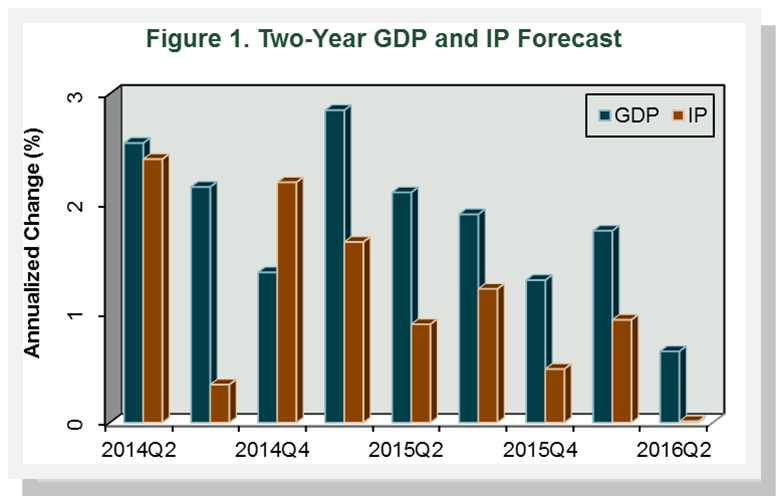
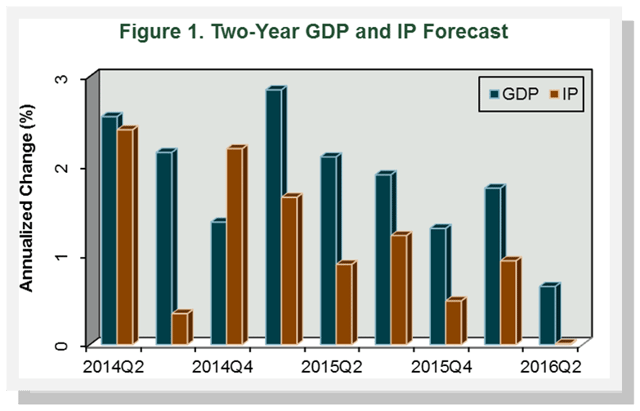
F2M forecasts that 2Q2014 IP will increase relative to 1Q2014 by an annualized rate of 2.4%. IP growth will subsequently fluctuate between 0.0% and 2.2% through the remainder of the forecast, averaging 1.1% overall.
Some upside potential exists for this forecast as there are some signals that firms may finally be increasing capital spending, which could in turn translate into greater capacity and production. Several potential drivers behind the change in direction have been advanced, although it is still unclear if the recent improvement is the start of a long awaited trend. Meanwhile, productivity growth, generally the result of capital spending, continues to languish.
We suspect firms’ past reluctance to invest was mainly driven by the overhang of capacity from the Great Recession and heightened uncertainty. But with capacity utilization now approaching pre-recession levels, capital-project returns are beginning to look more compelling; cash is accessible and financing is still attractive. Some counter that corporations’ cash “hoards” would be better spent on mergers and acquisitions rather than building new assets. While a compelling argument, we believe current rich stock market valuations will dull its allure for many.
Should these early capital-spending signals materialize, the main risk is whether or not consumer demand follows suit and is sufficiently maintained to justify expanded production from increased capital spending. Favorable demographics aside, the key 20- to 29-year-old age cohort needs to have enough jobs and income to create demand for these products.
Manufacturing and Non-manufacturing
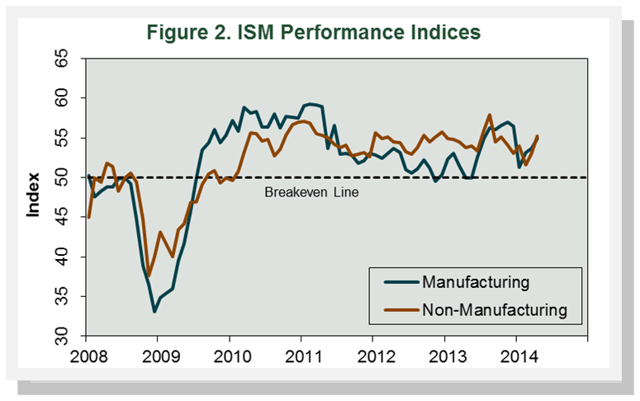
According to the Institute for Supply Management’s (ISM) monthly opinion survey, expansion of economic activity in the U.S. manufacturing sector sped up again in April. The PMI registered 54.9%, an increase of 1.2 percentage points (50% is the breakpoint between contraction and expansion). ISM’s manufacturing survey represents under 10% of U.S. employment and about 20% of the overall economy. Continued growth in the export and import sub-indiceswere the main sources of support for the improving conditions.
Wood Products expanded in April, thanks to gains in employment. Paper Products grew, with widespread support among the sub-indices.
The non-manufacturing sector, which accounts for 80% of the economy and 90% of employment, picked up the pace of expansion in April. The NMI registered 55.2%, a 2.1 percentage point gain. Two sub-indexes in the NMI — the Business Activity Index and the New Orders Index — have good correlations to the economy; both grew faster in April.
All three of the individual service industries we track expanded in April, with near-universal improvement in employment and orders (new, backlogged and import/export).
Commodities up in price included lumber, building materials, wood pallets, diesel and gasoline, copier paper, paper products, and natural gas. Commodities down in price included spruce studs.


