As biopower markets in Asia mature, the increased competition for wood pellets and chips will provide opportunities for suppliers of these materials around the globe. Because biomass pellets can be made with low-cost wood raw materials and the cost of shipping is low, the number of potential suppliers is significant. Biopower producers in Japan, South Korea and other emerging Asian markets will require a secure and consistent supply of both pellets and chips, sometimes from multiple suppliers in multiple geographies. As a result, they will require strong procurement strategies, supply chain risk assessments, cost analyses, supplier diligence processes and contract negotiation strategies.
This is the seventh installment of our series on global supply regions that currently, or could in the future, supply Asian biopower markets. Part 1 focuses on the US South, Part 2 covers the US Pacific Northwest, Part 3 covers British Columbia, Part 4 covers Brazil, Part 5 covers Chile and Part 6 covers Vietnam.
The only sovereign nation that is also a continent, Australia is the sixth largest country in the world. With just over 769 million hectares (1.9 billion acres) in total land area, Australia is quite large and boasts a unique geography and extremely diverse landscape. Due to its location between the South Pacific Ocean and the Indian Ocean, it is also a valuable trading partner and supplier of wood raw materials and wood products to Asian destinations.
Forest Inventory & Profile
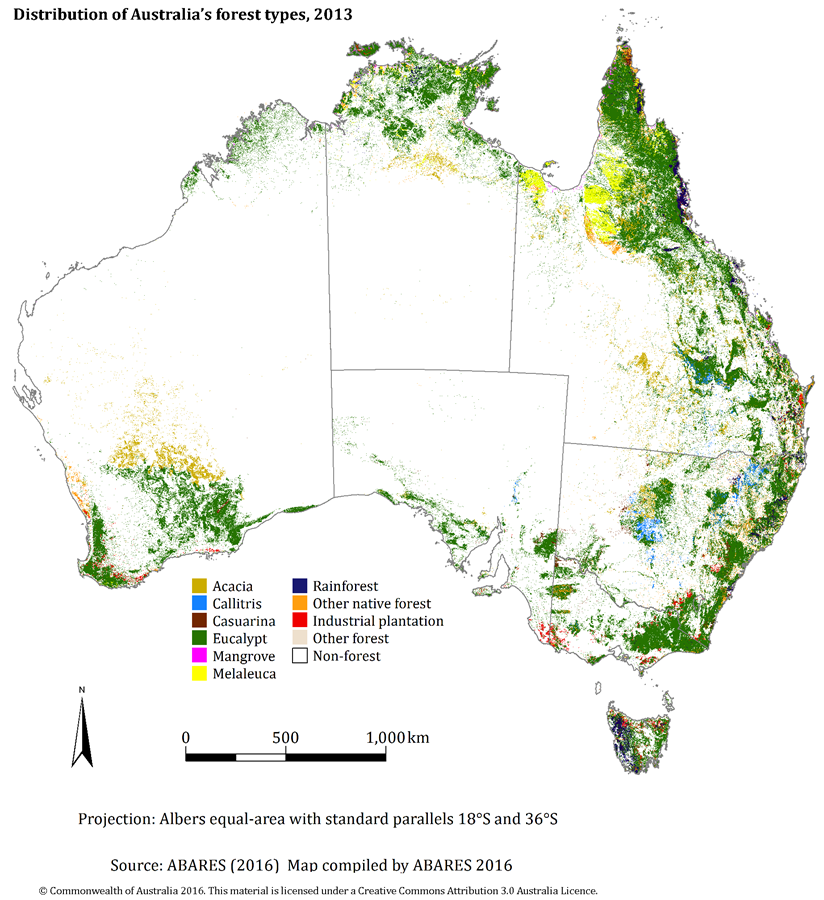
Most of Australia’s forests are located along the northern and eastern coasts, though the southwestern coast also contains forests. The island of Tasmania off the southern coast is also heavily forested with stands of industrial plantations and native forests as well as rainforests that cover most of its western coastline. Australia’s total forested area comprises approximately 125 million hectares (309 million acres), which equates to roughly 16 percent of the total land area.

Australia’s native forests cover an area of 123 million hectares (304 million acres); of this total, roughly 37 million hectares (91 million acres) are suitable for commercial wood harvesting. Public native forests comprise roughly 8 million hectares (20 million acres), and leaseholder/private native forests comprise roughly 29 million hectares (71 million acres) of this total.
Australia also has roughly 2 million hectares (5 million acres) of highly productive industrial plantation forests that have been funded primarily by institutional investors since the mid-1990s. Australia boasts a significant hardwood plantation inventory: Roughly half of its plantations grow various hardwood gum species that are used in the production of pulpwood. The other half of its plantations is comprised of softwoods that are dominated by Radiata Pine.
The total plantation land area has diminished very slightly over the last two years as a result of plantation managers revising their area figures, unproductive plantations being returned to agricultural purposes or the expiration of lease arrangements. In parts of Australia, however, plantations can yield up to 14 times more wood per hectare than native forests, largely due to continued improvements in silvicultural management practices. These improvements are a major reason for the increased wood yields that ensure high-quality and cost-competitive timber products.
In 2014, Australia’s total harvested log volume was 25 million metric tons; plantation harvests totaled 21 million metric tons, and total native forest harvests were 4 million metric tons. Eighty-four percent of the total harvest volume came from plantations, which demonstrates the productivity of its plantation sector.
Ownership/Supply Chain Characteristics
Of the 123 million hectares of Australia’s native forest, roughly 82 million hectares (203 million acres) are under some form of private management; 49 million hectares (121 million acres) are Crown lands operated under private leases, and 33 million hectares (82 million acres) are lands held under private title. Six ownership classes are used for segmenting native forests in the National Forest Inventory, which are grouped on the basis of being publicly or privately held (with a small area in the “unresolved” category).

Source: Australian Bureau of Agricultural and Resource Economics and Sciences
About 41 million hectares (101 million acres) of Australia’s native forests are also identified as part of the Indigenous Estate, most of which are located in Queensland and the Northern Territory.
The ownership structure for industrial plantations is different than native forests, as land ownership can differ from ownership of the actual trees on the land, and management arrangements are oftentimes complex. In 2015, 50 percent of the total commercial plantation area was held by institutional investors, 21 percent by government, another 21 percent by private growers, and roughly 5 percent by managed investment schemes (MIS).
Australia’s plantation processing industry comprises a number of large international companies. In recent years, the plantation processing sector has also invested heavily in the development of modernized and efficient sawmills, reconstituted and engineered wood production facilities and efficient pulp mills. Continued development of plantation forests will support further investment in the plantation processing sector, and this investment will assist in developing new export and value-adding industries.
As noted above, plantations produce a majority of the harvested logs in Australia, and the potential supply of coniferous plantation logs is not expected to change significantly over the next 15 - 20 years. Thereafter, the supply should then increase by around 1 million metric tons per year to 2054. The potential supply of coniferous plantation pulpwood is not expected to change significantly for the next few decades.
Pellet and Chipmill Supply
Over the last five years, non-coniferous chips—primarily Eucalyptus species—have been exported from Australia at a rate of around 6 million metric tons annually. Coniferous chips were exported at a rate of around 1.2 million metric tons annually between 2012 and 2015 before dropping to just under 300,000 metric tons last year. Most of this chip supply is exported to Japan and China primarily for use in making paper. In 2015, non-coniferous chip exports to China surpassed non-coniferous chip exports to Japan, a trend that continued in 2016. More coniferous chip exports still go to Japan than to China, but the gap has narrowed in recent years.
In comparison to chips, pellet exports make up a much smaller volume. Currently, Altus Renewables based in Brisbane on Australia’s east coast is the only major pellet supplier in operation. However, last month, Plantation Energy secured funding to recommission a wood pellet plant located in Albany on Australia’s west coast that had been closed for five years.

The following table details the cost components associated with producing and exporting green and dry wood chips, as well as potential pellet exports, from Australia to ports in East Asia. Currently, a number of port facilities are equipped to handle chip exports. Transportation costs to the port are lower than in some other countries since much of the wood resource rims the coastlines, and this advantage is reflected in both the green and dry chip price ranges. While Australian suppliers are not as close to the East Asia destinations as other southeast Asian suppliers, they do hold a competitive ocean freight advantage over the US South and South America. The available wood resource, production and port facilities and both land and sea transport distances make Australia competitive for supplying wood chips and pellets to Asian locations. The average minimum delivered cost of chips from an Australian port would be roughly US$66 per green metric ton.