
 Daniel Stuber
Due to the intricate supply chain and manufacturing processes in the forest products industry, a noticeable shift in the marketplace generally occurs at a relatively slow pace. But global demand for forest raw materials is changing the speed at which the supply chain must react. A recent visible change occurred in the export market to China. In 2015, China increased its purchases of Ponderosa pine logs from the Pacific Northwest while decreasing its purchases of southern yellow pine (SYP) from the US South.
The shift in demand is likely unrelated to any differences in product specifications, but is simply due to the 24 percent appreciation of the Chinese renminbi against the US dollar (USD) from 2014 to 2015. This exchange rate made marginal purchases of SYP from the South and Doug Fir/Hemlock purchases from the Pacific Northwest cost prohibitive. At the same time, low-cost Ponderosa pine became available in larger quantities because of the availability of salvage logs from the massive Okanogan Complex fire in 2015.
That said, the numbers don’t lie: from 2014 to 2015, Ponderosa pine exports to China increased by 104,204 cubic meters while US South pine exports decreased by 222,718 cubic meters[1].
Pine Export Trends
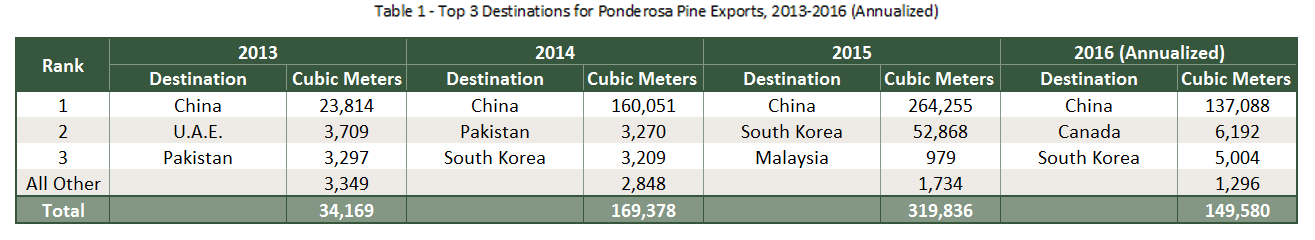
In the Pacific Northwest, exports of Ponderosa pine have provided a small niche market for timber sellers as China continues to purchase the majority of volume (Table 1, Figure 1). 

While still short of Doug fir and hemlock volumes, and while almost non-existent in prior years, Ponderosa pine’s percentage of exports has increased since 2013, averaging 7% for 2015 (Figure 2). The increase is primarily attributable to a decline in pricing (Figure 3) that has attracted buyers from China and provided an alternative to higher marginal cost Doug fir and hemlock.

Numbers for 2016 are only available through January but on an annualized basis, they reflect how the current strength of the USD is having a downward effect on demand. At January’s rate, Ponderosa pine is likely to fall to 5% of the export mix and while export prices (logs loaded in the ship) have declined $5 per cubic meter, log prices delivered to the port gate have only fallen $1 per cubic meter.


Similar to Ponderosa pine, SYP exports are not a large part of the export market, but this product has provided a niche for a few sellers. Again, China is the primary purchaser but a large supply is also being shipped to India (Table 2, Figure 4).

Exports of SYP have increased since 2010, but 2015 marked a sharp decline as both China and India pulled out of the market. In comparison to Ponderosa pine, SYP exports in 2015 were almost 200,000 cubic meters (63 percent) greater in volume and $44 per cubic meter (31 percent) higher in price (Figure 5). While domestic delivered prices for SYP were flat in 2015, export prices increased $9 per cubic meter – likely the main driver (along with exchange rates) that pushed demand away from the South.
We’ll continue to monitor these trends as 2016 progresses, but more than likely as the dollar remains strong against other currencies, we’ll see foreign demand continue to wane for both of these pine products.


[1] Based on U.S. Census Bureau district trade data for domestic exports of harmonized commodity codes: 4403200020, 4403200025, 4403200030, 4403200060 and 4403200065


