
Every month, Forest2Market publishes updated forecasting products designed specifically for participants in the forest value chain. The Economic Outlook is a macroeconomic indicator forecast that supplies critical information, context and insight about general economic trends and direction, and the 4Cast supports regional operational decision making for those who buy and sell timber. With an understanding of economic indicators, future stumpage prices and insight into buying and selling windows (periods in which buyers or sellers hold relative market advantage), subscribers are better able to time sales or purchases, negotiate prices, manage workloads and control inventory levels. The following commentary is just a sampling from the most recent Economic Outlook for August, 2019.
Oil Prices
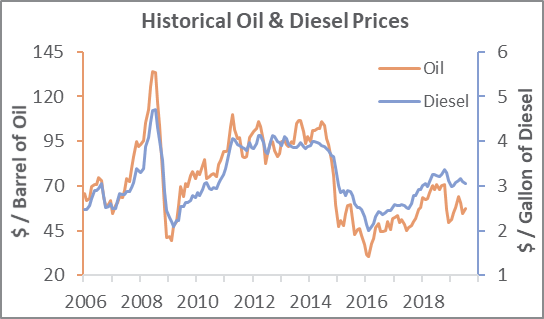
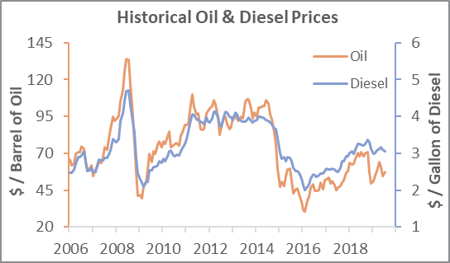
The monthly average US-dollar (USD) price of West Texas Intermediate (WTI) crude oil edged higher in July, advancing by $2.70 (+4.9 percent), to $57.36 per barrel. WTI went from peak (7/10: $60.25) to trough (7/18: $55.08) in barely more than a week; it gradually trended back to $58.53 by 7/31 but “fell out of bed” on 8/1 ($53.64)—the worst single-day performance in over four years—in the wake of President Trump’s surprise threat to impose a 10 percent tariff on another $300 billion worth of Chinese imports (subsequently delayed).
Loss of demand from a protracted trade war with China is the most obvious downside risk to oil’s price. Sources of upside risk come from OPEC’s production falling to an eight-year low in July: Libya’s Sharara field has been cycling on/offline for weeks, and Iran’s oil exports may have plunged by 75 percent since June. On balance, oil will continue to move mostly sideways within a range between $54 and $69 per barrel.
Exchange Rates
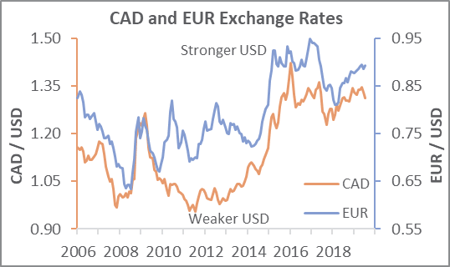
In July the monthly average value of the USD weakened versus the Canadian dollar (CAD: -1.4 percent) but appreciated against the euro (EUR: +0.7 percent). The average CAD/USD rate was C$1.311; EUR/USD: €0.892. On a trade-weighted index basis, the USD lost 0.3 percent against a basket of 26 currencies.
The CAD’s strength was attributed to Canada’s economy outperforming the United States’ for the first time in eight quarters. Indeed, Canada’s 2Q real GDP growth is tracking at a SAAR around 3 percent, well above the concurrent US rate of 2.1 percent, and better than the Bank of Canada’s expectations of 2.3 percent growth. Tepid 2Q GDP growth (+0.8 percent SAAR) in the Eurozone, along with expectations throughout July of further easing by the ECB, undermined the EUR.
Disappointment over the Fed’s 0.25 percent rate cut and the US Treasury declaring China a currency manipulator have fed speculation that the Trump administration may attempt to weaken the USD by intervening in the currency markets. Admittedly, it would be a tall order to successfully influence a market that trades $4 trillion per day, but the Treasury could potentially employ “countervailing currency intervention” (i.e., make targeted purchases of specific currencies) to drive up their values. Doing so could act as a kind of “nuclear deterrent” to discourage other countries from manipulating their own currencies, said former Treasury official Fred Bergsten.
In the meantime, we look for the CAD to trend marginally stronger and the EUR to trend slightly weaker versus the USD.


