2 min read
Crunching the Numbers with a Forest2Market Data Specialist
Melissa Reynard : March 9, 2017

46,065,813. That’s right; over 46 million. That’s the number of individual transactions Forest2Market added to its databases in 2016 alone. That’s a whole lot of numbers, and a whole lot of data to keep track of.
Have you ever wondered about the intricate processes that actually make Forest2Market datasets so unique?
Every month we receive millions of transactions from buyers and sellers of wood raw materials and wood products all over North America, Brazil and the Baltic Rim. These transactions are used to produce some of our most popular products, including:
- A database of current stumpage sales that details average prices by region.
- A weekly lumber price report that tracks up-to-date and detailed product pricing, including how much that #2 KD SYP 2x4 8’ is going for.
- Quarterly benchmark reports that provide unparalleled insight into cost components vs. the market.
This data is also used to produce highly-specialized, custom reports based on your individual needs so you can access the metrics you need to improve your business performance.
You have come to recognize our detailed reports, our coverage of industry happenings and trends, and our understanding of current costs in the marketplace. Coupled with our deep industry experience, we also rely on this data to provide insight into everything we do.
How exactly do we handle this data?
Forest2Market’s Operations team receives raw transaction data from our customers on both a weekly and monthly basis. These transaction details arrive in a variety of formats, at which time our experts get to work. The data is standardized, amended to fill in any missing pieces (including stumpage, freight and other cost components), and then finalized and stored in one of our databases. Once this happens, the data is ready to use to compile benchmarks, reports, custom analytics and more.
That process sounds simple enough on the surface, but let’s break it down even further.
Our wood raw materials and wood products data must be as accurate as possible, and must include variables such as:
- Where the data originates
- The source type of the data
- The product(s) represented by the data
- The size of the products (when applicable)
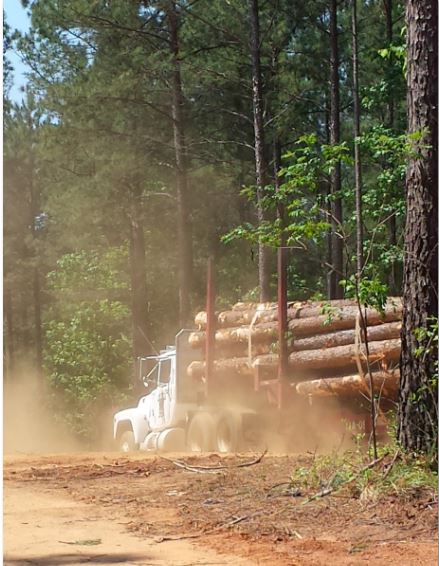
In some cases, we simply don’t have access to all of these extra components, which is where our extensive database with a total of 306 million rows of data also helps to fill in the gaps. When an individual cost component is missing—such as a freight cost—we are able to narrow the focus and drill down to the origination and destination areas to analyze rates. So, for a load of timber headed somewhere in South Carolina for example, we know how far it traveled, what comparable facilities in the region paid for freight and, synthesizing all of this data, we can deduce a freight rate that is accurate and reflective of the zone. This allows us to fill in the gaps for those loads of timber that might have been gatewood or shipped in-woods, and allows us to maintain accurate data inclusive of all relevant cost components.
We then use all of this data—literally millions and millions of individual components—to produce the most reliable pricing information in the forest products value chain. Maintaining all of this data also allows us the ability to provide unique historical context, forecasting models and much more. We love numbers at Forest2Market; such a high level of detail guarantees unique insights into the fiber supply chain. With this data, our customers are able to make high-value business decisions with confidence.


