
 Joe Clark
Forest industry performance in January and February was recently reported by both the US government and the Institute for Supply Management.
Total industrial production (IP) decreased 0.3 percent in January (unchanged on a YoY basis), thanks to unseasonably warm weather contributing to a 5.7 percent drop in utilities. Total IP peaked in November 2014, just one percentage point higher than its pre-recession peak in November 2007. Moreover, it contracted MoM during 16 of the last 25 months. There are some hints IP may be on the cusp of a turn-around, however. Manufacturing output (which accounts for nearly 80 percent of total IP) moved up 0.2 percent (+0.5 percent YoY) in January—the fifth consecutive MoM gain; mining output jumped 2.8 percent.
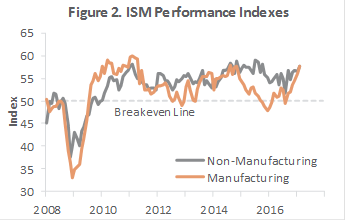
The Institute for Supply Management’s (ISM) surveys showed that the expansion in US manufacturing accelerated by 1.7 percentage points during February, to 57.7 percent—its fastest pace since August 2014 (50 percent is the breakpoint between contraction and expansion). Growth in employment slowed, however, despite faster new orders and production. The pace of growth in the non-manufacturing sector gained 1.1 percentage points, rising to 57.6 percent—the highest reading since February 2015. No sub-index value fell below 50. Of the individual industries we track, only Real Estate contracted.

The consumer price index (CPI) increased 0.6 percent in January, the largest MoM jump since February 2013. A 7.8 percent rise in the gasoline index accounted for nearly half the increase, and advances in the indexes for shelter (rent: +0.3 percent), apparel, and new vehicles also were major contributors. To the extent the CPI reflects actual rising price pressures, the implication is that consumer spending may not provide a big boost to GDP in 1Q2017. When adjusted for inflation, consumer spending fell 0.3 percent in January, the first drop since August and the biggest in three years.
January’s producer price index (PPI) increased 0.6 percent (+1.6 percent YoY). Over 60 percent of the MoM advance in the final demand index is attributable to a 1.0 percent increase in prices for final demand goods—and more specifically, a 12.9 percent increase in the gasoline index. The index for final demand services moved up 0.3 percent.
Most of the forest products-related PPIs we track decreased in January:
- Lumber & Wood Products: -0.2 percent (+1.7 percent YoY)
- Softwood Lumber: -0.1 percent (+7.7 percent YoY)
- Wood Fiber: -0.2 percent (+0.5 percent YoY)
- Pulp, Paper & Allied Products: +0.3 percent (+1.5 percent YoY)


