 Suz-Anne Kinney
Forestry-related industry performance improved slightly from last month in both the manufacturing and non-manufacturing sectors.
Industrial production (IP) decreased 0.1% in December (in line with expectations) after rising 1.3% in November. The decrease in December reflected a sharp drop in the output of utilities (utilities make up 9.8% of the IP index), as above-normal temperatures reduced heating demand. Excluding utilities, IP rose 0.7%. The index for mining (15.9% of the IP index) increased 2.2%.
Manufacturing (representing 74.3% of the IP index) posted a gain of 0.3% for its fourth consecutive monthly increase. Wood Products output retreated by 1.2% while Paper rose 0.1%. Construction rose 1.4%, and consumer goods retreated 1.1%.
Capacity at the all-industries and manufacturing levels moved higher by, respectively, 0.3 and 0.2%. Wood Products extended its ongoing (since July 2013) upward trend, increasing by 0.4%. Paper capacity, on the other hand, contracted by 0.2% to another new low.
Capacity utilization (CU) for all industries decreased 0.4% in December to 79.7%, a rate that is 0.4 percentage point below its long-run (1972–2013) average. Wood Products CU fell by 1.6% (to 70.8%, 3.3% below its November 2011 peak) while Paper rose 0.3% (to 84.2%, 1.6% below its December 2007 peak).
The look forward provided by durable goods orders gives some cause for concern. Orders not only declined by an unexpected 3.3% in December (+0.7% expected), but November’s data was also revised substantially lower (to -2.2%, from -0.7%). “More numbers like this and the risk of the Federal Reserve backing off its [expected] rate hike becomes more real,” said Jennifer Lee, an economist with BMO Capital Markets.
Manufacturing and Non-manufacturing
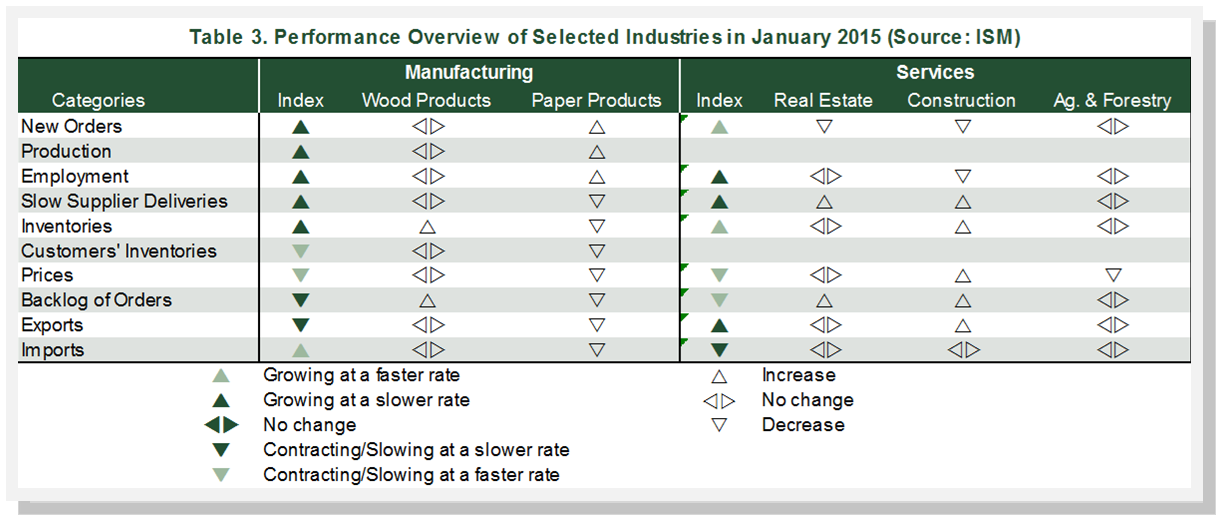
The Institute for Supply Management’s (ISM) monthly opinion survey showed that growth of economic activity in the U.S. manufacturing sector slowed again in January (Figure 2). The PMI retreated from December’s 55.1% (originally 55.5%) to 53.5% in January—its lowest reading since March 2014 (50% is the breakpoint between contraction and expansion). All sub-indices except inventories and imports were lower in January (Table 3).

Wood Products expanded in January, although supporting changes in the sub-indices were limited to inventories and backlogged orders. Increasing new orders, production and employment were sufficient to put Paper Products into expansion category. The ongoing West Coast port slowdown figured prominently in respondent comments. “Chinese New Year, West Coast port dock slowdowns, coupled with railroad embargo are all creating logistical challenges and increased backlog of orders,” wrote one Wood Products respondent. “West Coast port slowdown is getting serious,” added a Paper Products respondent. “[Our] mill has 40+ days of production at the ports and various warehouses.”
The pace of growth in the non-manufacturing sector managed to eke out a small gain. The NMI registered 56.7%, 0.2 percentage point above December’s 56.5% (originally 56.2%). The sub-indices were generally higher than in December; notable exceptions included employment, input prices and imports.
Real Estate and Construction reported contraction; in both cases the drop-off in new orders (along with employment in the case of Construction) negated any countervailing impacts of other sub-indices. The comment from one respondent that “construction demand is growing” apparently was not representative of the entire industry.