US housing starts dropped 3.6 percent in the first month of 2020, however new building permits rose to a nearly 13-year high, signaling that builders are optimistic about spring activity.
Housing Starts, Permits & Completions
Privately-owned housing starts were down 3.6 percent in January to a seasonally adjusted annual rate (SAAR) of 1.567 million units. Single-family starts decreased 5.9 percent to a rate of 1.010 million units; starts for the volatile multi-family housing segment rose 0.7 percent to a rate of 557,000 units.
Privately-owned housing authorizations increased 9.2 percent to a rate of 1.551 million units in January. Single-family authorizations were up 6.4 percent to a pace of 987,000 units. Privately-owned housing completions were down 3.3 percent to a SAAR of 1.280 million units. Per the US Census Bureau Report, seasonally-adjusted total housing starts by region included:
- Northeast: +31.9 percent (+25.5 percent last month)

- South: -5.4 percent (+9.3 percent last month)
- Midwest: -25.9 percent (+37.3 percent last month)
- West: +1.2 percent (+19.8 percent last month)
Seasonally-adjusted single-family housing starts by region included:
- Northeast: +3.1 percent (-7.7 percent last month)
- South: -12.2 percent (+11.3 percent last month)
- Midwest: -15.1 percent (+56.6 percent last month)
- West: +14.2 percent (-5.2 percent last month)
The 30-year fixed mortgage rate plunged in January to 3.62 from 3.94 in December 2019—an 8 percent decrease.
According to the latest National Association of Home Builders/Wells Fargo Housing Market Index (HMI), homebuilder confidence dipped one point lower to 74 in mid-February. However, the last three monthly readings indicate the highest sentiment levels since December 2017.
"Steady job growth, rising wages and low interest rates are fueling demand but builders are still grappling with increasing construction and development costs," said NAHB Chairman Dean Mon.
Conflicting Pieces of the Housing Market Puzzle
As the latest issue of The Economic Outlook notes, two current metrics seem to provide conflicting views about home-buying activity spanning the next few months: Loan applications for home purchases reached an 11-year high in late January, while December’s pending home sales dropped by 4.9 percent. An alternative explanation is that extremely tight resale inventory is driving more homebuyers to the new home market.
Although home sales were up strongly overall in 2019, Navy Federal Credit Union’s Robert Frick found December’s new home sales disappointing. “A clue to the lack of a vigorous new home market was that once again the median sales price rose, and is now up to $331,000,” Frick said. “Considering half of home shoppers say they can’t afford a house priced above $300,000, more builders must start reducing prices to increase sales.”
The housing affordability problem is “driven by a combination of stagnant wages, restrictive building codes, and underinvestment in construction, among other trends,” wrote The Atlantic’s Annie Lowry. “Home prices are rising faster than wages in roughly 80% of American metro regions.”
Looking forward, Robert Frick argues that “with housing starts surging we should see plenty more new homes on the market this year, but if they’re not more affordable, sales will be stunted, and many more newly-formed families will be shut out of homeownership.”
Optimistic Trends
In a departure from our customary monthly analysis, we have chosen to look at the most recent two years’ worth of housing starts data to help visualize trailing averages rather than month-over-month (MoM) performance. Trailing averages allow us to compare a measurement against a like measurement from a prior term to decipher how much growth (or loss) was realized. Based on that growth, trailing averages will also provide us with a more representative snapshot of overall performance over time, as well as growth trajectory.
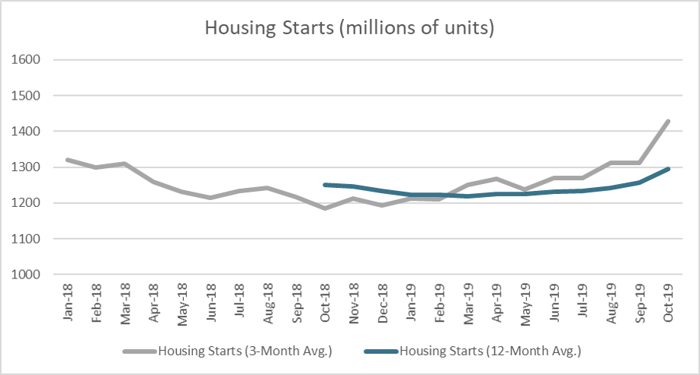
While a simple trailing average chart is not meant to substitute as a comprehensive forecast, the chart can be used to discern general indications of market direction. What can we determine from the trailing average data in the chart above?
- The trailing 3-month average line naturally demonstrates more volatility than the trailing 12-month average line, which covers a longer period of time and smooths out some of the peaks and valleys. In the chart above, the 12-month average line is largely flat, but demonstrates a noticeable increase beginning in 3Q2019.
- The trailing 3-month average line is a better indicator of short-term performance as it utilizes data from the previous quarter. Notice the point in February 2019 where the two lines intersected, and the 3-month average overtook the 12-month average. Since that time, the 3-month average line has continued to increase and separate itself from the longer term 12-month average line.
If demand for new housing remains robust, homeownership rates could add to the recent advances we saw in December 2019; the US homeownership rate rose to a six-year high in 4Q, led by gains among young people and low-income Americans. The nationwide rate was 65.1 percent, the highest since the end of 2013, and the second straight quarterly increase (from 64.8 percent in 3Q as well as a year earlier).
Housing affordability is an issue that the market will address in time. Based on current economic data and the analysis presented above, housing starts have clearly been gaining ground over the last year. The fact that both the 3- and 12-month averages continue to trend upward suggests that there is momentum behind the homebuilding sector as we enter a new decade.