
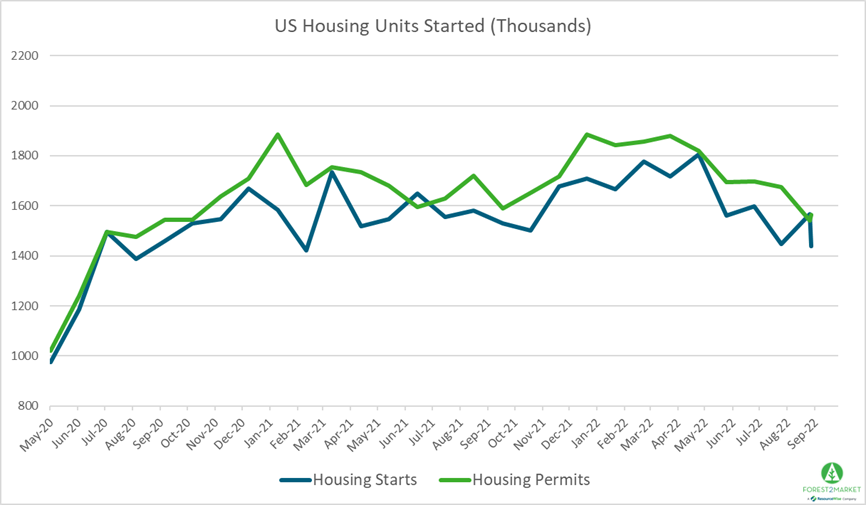
After jumping 12% in August due in part to strong demand from the multi-family construction sector, US housing starts dipped by 8% in September to their lowest level since February 2021. Single-family building continues a precipitous month-over-month (MoM) drop; starts for this segment are down 27% over the last 10 months to their lowest level since June 2020.
Housing Starts, Permits & Completions
Privately-owned housing starts decreased 8.1% in September to a SAAR of 1.439 million units. Single-family starts were down 3.1% to a rate of 872,000 units and starts for the volatile multi-family segment dropped 13.2% to a rate 530,000 units.
Privately-owned housing authorizations were up 1.4% to a rate of 1.564 million units in September, and single-family authorizations were off 3.1% to a pace of 872,000 units. Privately-owned housing completions were up 6.1% to a SAAR of 1.427 million units. Per the US Census Bureau Report, seasonally-adjusted MoM total housing starts by region included:
- Northeast: -12.5%
- Midwest: -2.7%
- South: ‐13.7%
- West: +4.5%
Seasonally-adjusted MoM single-family housing starts by region included:
- Northeast: -6.5%
- Midwest: -13.8%
- South: +2.5%
- West: -15.8%
In September, the 30-year fixed mortgage rate jumped to 6.11%, its highest level since June 2008. The NAHB/Wells Fargo Housing Market Index (HMI) dropped 8 points to 38 in mid-October to its lowest level since 2012. “High mortgage rates... have significantly weakened demand, particularly for first-time and first-generation prospective home buyers,” said NAHB Chairman Jerry Konter. “This situation is unhealthy and unsustainable.”
Market Trends
Our most recent issue of the Economic Outlook notes that, in terms of the impact of mortgage rates on affordability, “this year and last year might as well be in different decades,” wrote Slate’s Henry Grabar. “Nationally, the monthly mortgage payment on the median-price U.S. home has doubled in just two-and-a-half years. It’s the most severe affordability shock on record, writes David Doyle, head of economics at Macquarie. ‘So if you want to spend $2,500 a month, you can now buy a house that costs $476,425,’ Bloomberg’s Joe Weisenthal observes. ‘For that same monthly payment, you could have purchased a $758,572 house in early 2021.’”
These conditions create a dilemma for the Fed because, as UBS noted, the decline of the U.S. housing market is simultaneously disinflationary and inflationary. “It lowers demand for building materials and associated durable goods, but people still have to live somewhere,” they observed. “If people are not buying houses, but are determined to move out of their parents’ basements, this means higher rents and more upward pressure on the [mythical] owners’ equivalent rent measure.”
Longer-term prospects for single-family home construction are brighter, according to the Kansas City Fed’s Jordan Rappaport. He argues that years of under-building, which has left a housing deficit of at least 1 million homes, coupled with a shift to hybrid work models and commuting mean an expansion for single-family construction is coming after the current downturn—eventually rising to a long-term annual rate of 1.4 million units. If single-family starts continue comprising approximately 70% of total starts, Rappaport’s forecast would translate to roughly 2 million total starts.
While concurring demographic fundamentals support this outlook, economic headwinds are likely to keep starts well below that level in the near term.


