 Bruce Janda

The Southeast Asia region of Brunei, Myanmar, Cambodia, East-Timor, Indonesia, Laos, Malaysia, the Philippines, Singapore, Thailand, and Vietnam are included in the demand side analysis in this report. However, Cambodia, Laos, Singapore, and Timor-Leste do not have tissue production, so they will not be included in the tissue export and production analysis.
The tissue capacities of Brunei and Myanmar are minimal, with only one or two machines that will be difficult to show on charts with the other much larger producers. A map of this region is shown in Figure 1 and the country color range illustrates the current rate of Covid-19 infections per one million population in May 2021. Myanmar is in significant political unrest, so data reports may not be as reliable.
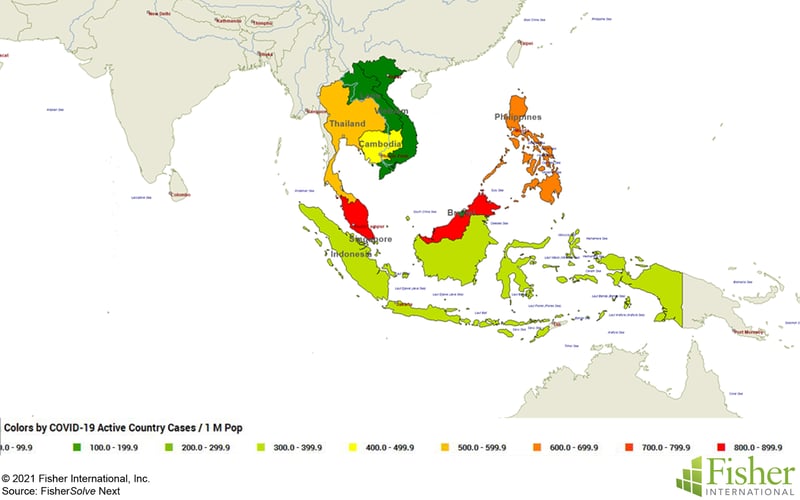 Figure 1: COVID-19 Active Cases per 1 Million Population
As we can see, Malaysia is currently having the highest rates of infection in the region, while moderate infection rates have been reported in the Philippines, Thailand, Cambodia, and Indonesia. Brunei, Laos, Singapore, and Vietnam are currently reporting a much lower infection rate. This means that the higher rate areas could be expected to experience production and distribution issues due to the pandemic until vaccines are available for most populations.
The population of each of the countries in 2020 is shown in Figure 2. Indonesia overshadows the others with almost 41% of the total population for the region. The Philippines is second with 16.4% and Vietnam third with 14.7% of the total population. Brunei and East-Timor are very small, with 0.1% and 0.2%, respectively. Population growth over the last 13 years for each of the countries in the region is shown in Figure 3 with the Philippines having the highest growth rate.
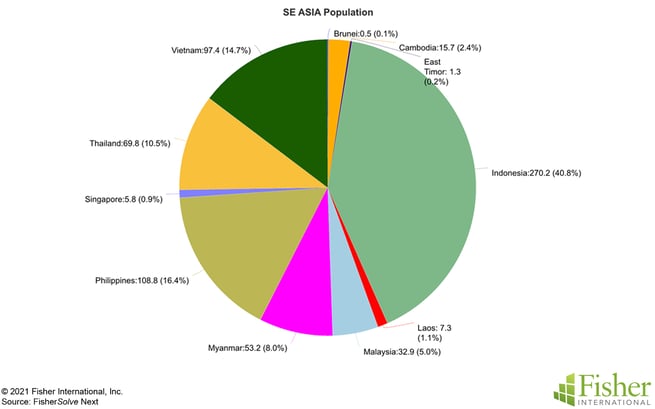 Figure 2: SE Asia Nations 2020 Population
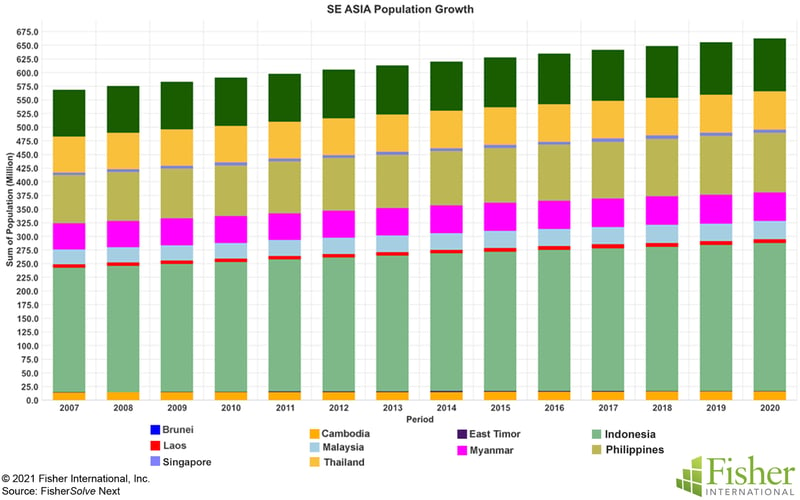
Figure 3: SE Asia Nations Population Growth
However, increased tissue demand requires more than just population growth. Figure 4 shows the purchasing power per capita for each of the countries. Singapore and Brunei may be small in population, but their consumers have a disproportionate impact on tissue buying. The growth of this purchasing power per capita over the study period is shown in Figure 5. As we can see below, Myanmar’s consumer purchasing power stopped growing in 2015, and overall regional growth didn't resume until 2017.
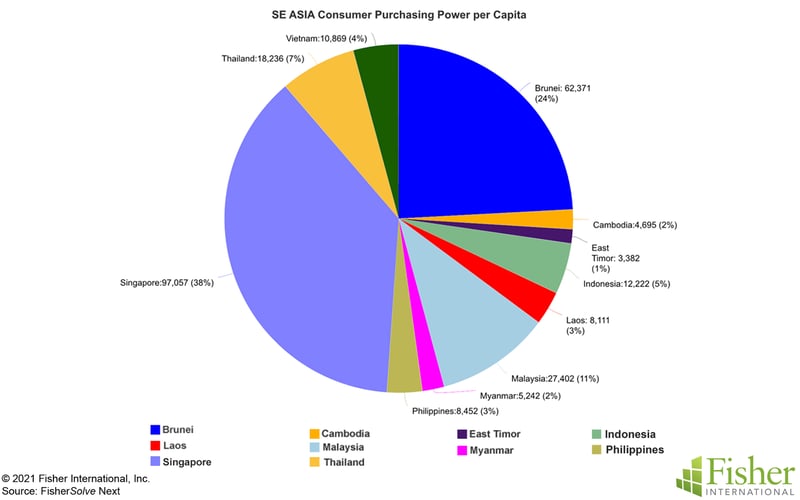 Figure 4: SE Asia Consumer Purchasing Power per Capita
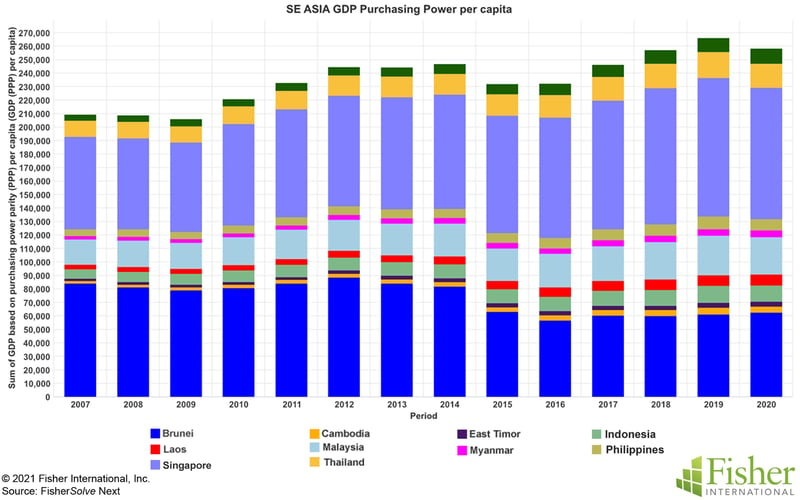
Figure 5: SE Asia GDP Purchasing Power per Capita
Unemployment rates provide another indicator of support for growing tissue demand. Figure 6 shows unemployment rates over the study period available for most of the countries within the region, illustrating that while the Covid-19 pandemic has affected the rise of unemployment in all countries, the Philippines has been hit the hardest.
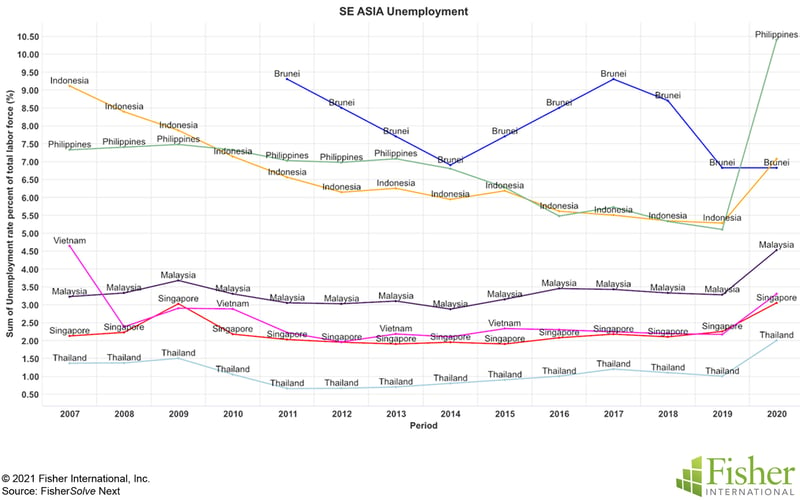
Figure 6: Southeast Asia Unemployment
Consumer insecurity due to inflation is another impediment to developing additional consumer tissue demand. Figure 7 presents the evolution of inflation in the region over the study period. Inflation has improved in all cases, but the range of effects between countries in this region is extensive. The development of imports of tissue by country is shown in Figure 8. Brunei, the Philippines, and Malaysia show the most growth in imports.
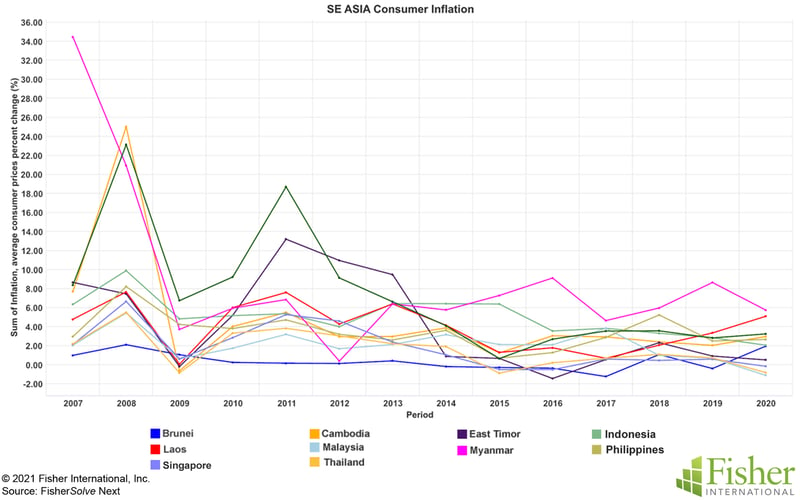 Figure 7: SE Asia Consumer Inflation
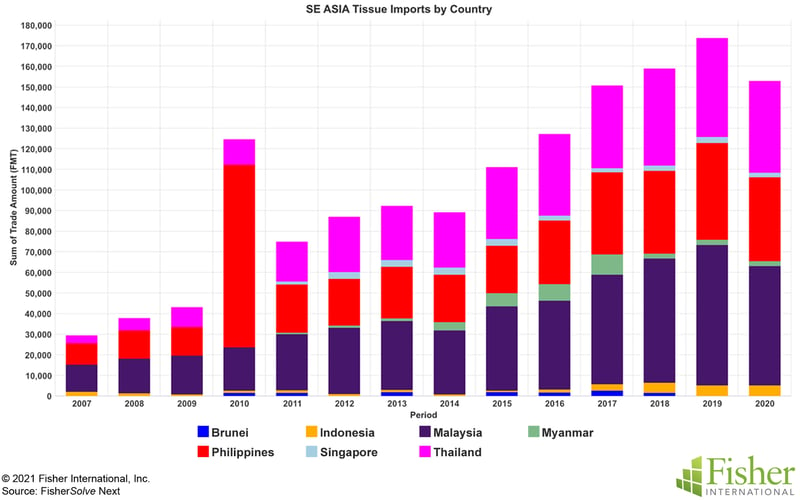
Figure 8: SE Asia Tissue Imports by Country
Tissue exports are charted for the producing countries in Figure 9, which illustrates Indonesia as the overpowering leader in exports and growth of exported tissue. These tissue exports from SE Asia are going to all regions of the world. Figure 10 shows the top 10 receiving countries for these exports. The top bar growing the fastest is the "all other" category, which is not included in the top 10 legend. Export volume has increased by almost 7x in the 13-year study period.
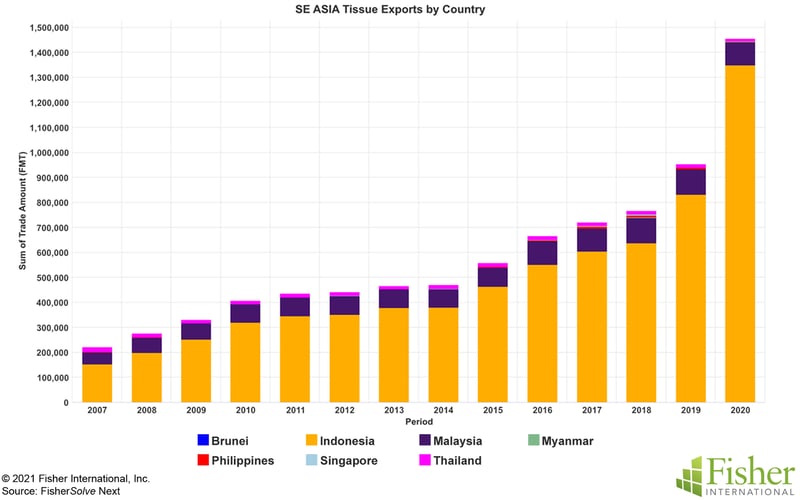 Figure 9: SE Asia Tissue Exports by Country
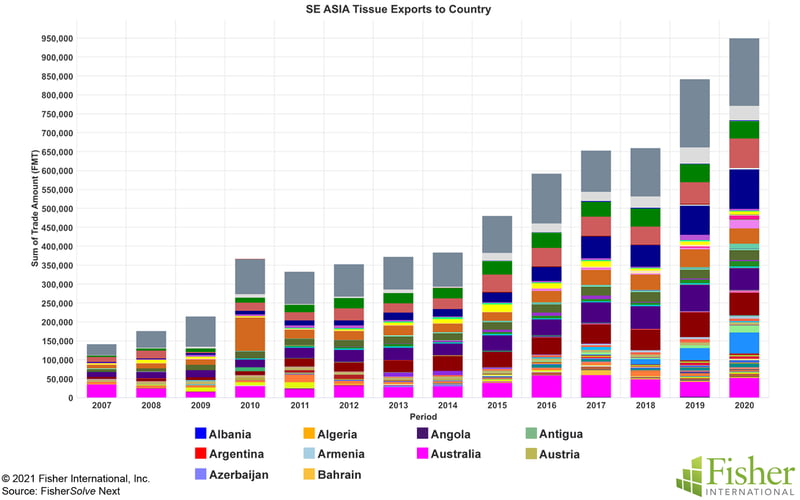
Figure 10: SE Asia Tissue Exports to Country
Indonesia has made the most significant change in the number of tissue paper machines added over the study period, as shown in Figure 11. The Philippines have removed the most machines in this period, with eight removed and only two added, which explains why Indonesia is the export leader in Figure 9.
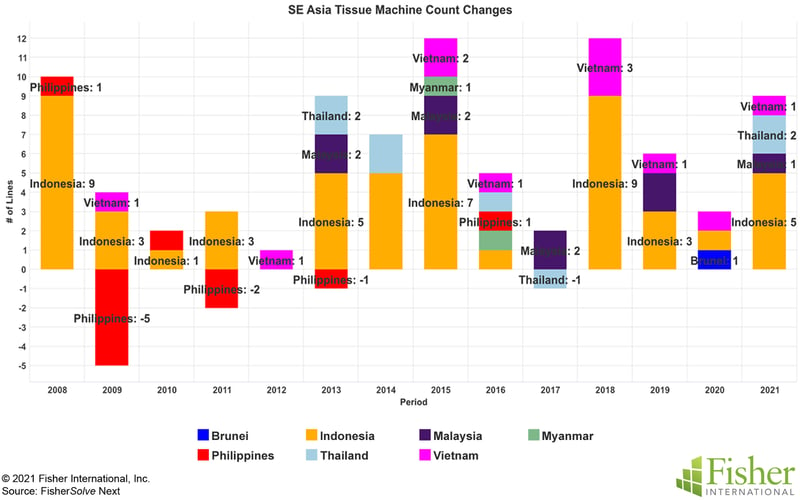 Figure 11: SE Asia Tissue Machine Count Changes
Figure 12 shows that SE Asia is focused on consumer tissue products, with bath tissue as the top category followed by facial tissue and towels. Hardwood is the leading fiber source, but more softwood is being seen in towels for strength and absorbency. Deinked recovered fiber is only significant in bath tissue and has a much smaller presence in other product formats.
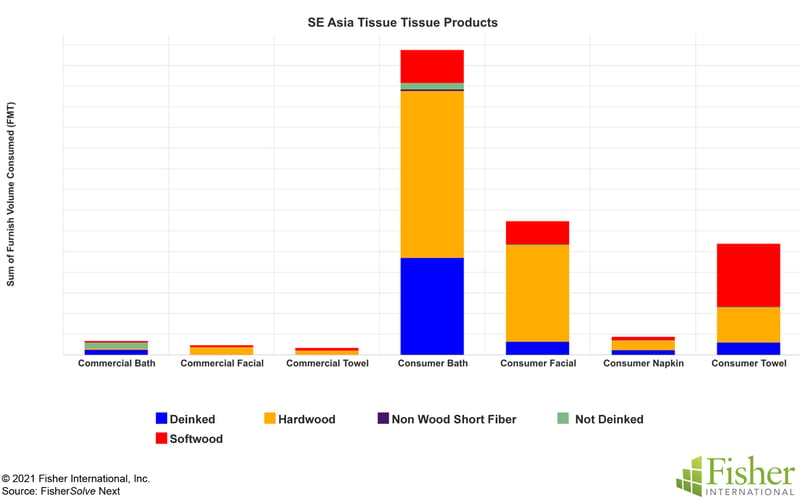 Figure 12: SE Asia Tissue Products and Fibers
Figure 13 compares SE Asian tissue machines by country to China and Australia in terms of average technical age on the x-axis and average speed on the y-axis. The size of the bubbles represents the size of each country’s tissue production per year. China has new but slower machines compared to Indonesia, whereas Australia has a relatively older asset base but still possesses the fastest fleet in the comparison. It’s important to remember that these bubbles represent averages, and some individual machines are better while some are worse.
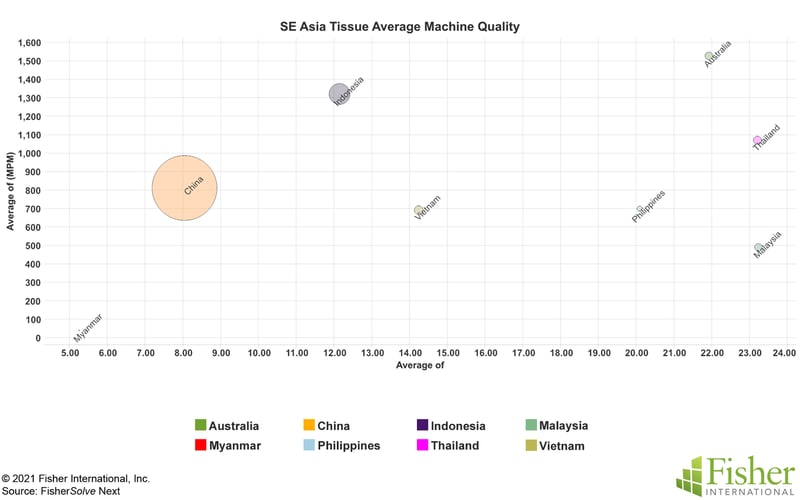 Figure 13: SE Asia Tissue Machine Average Quality
Figure 14 presents the relative average competitive position of each of the SE Asian countries compared to China and Australia. The Y-axis represents the average cost of production in a standard reference currency, and the x-axis represents the total production in tons. The colored bars signify the main cost components of fiber raw material, pulp, chemicals, energy, labor, overhead, and miscellaneous materials. Australia has a high-cost position due to pulp costs, along with China who has similarly high pulp costs as well as energy costs. Indonesia, however, has a low-cost position to support its export growth strategy with increasing local fiber sources. Vietnam, Malaysia, and Thailand have the most substantial use of local fiber sources, which helps keep their costs below that of China.
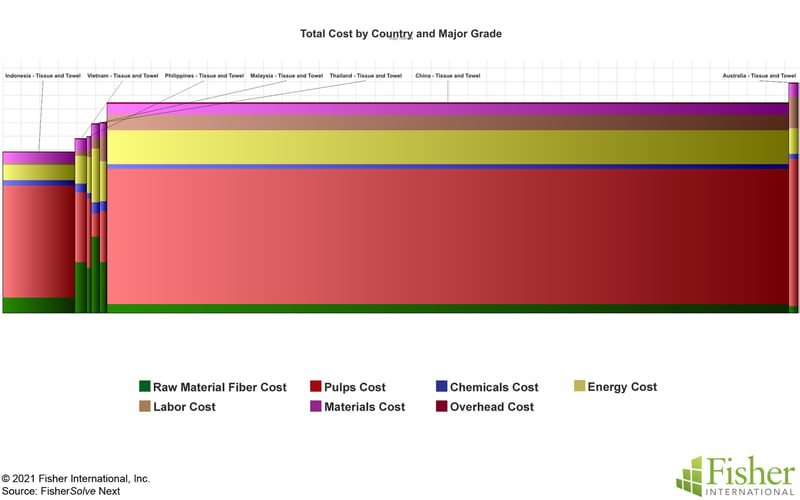 Figure 14: Tissue Production Cost Comparison
Indonesia is expected to continue to exploit its low-cost position to build the tissue export business. Additional low-cost fiber sources will become available for tissue production and replace purchased pulp to extend this advantage. The Philippines has taken a relative pause in building its tissue business, while Thailand, Malaysia, and Vietnam have opportunities to improve their tissue production business using local fiber to help keep costs under control. China is expected to rebuild and rationalize its tissue business to more productive assets, which could also provide increased competition in the region.
Analysis of competitive position requires specifics on tissue producers and individual machines. This article presents a static summary of Southeast Asia's tissue industry today. Fiber prices, exchange rates, and environmental regulations will change, providing participants with advantages and others with new challenges. SE Asia's tissue mills will continue to change hands and consolidate, while neighboring countries may invest in tissue-making capacity, affecting SE Asia's imports and exports. SE Asia's consumer tissue consumption trends are still evolving. Stay tuned for changes.