
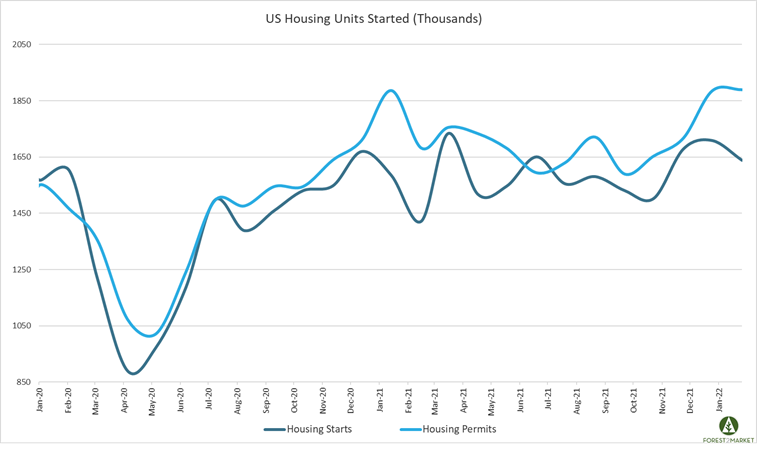
US housing starts dropped more than expected in January as many parts of the country were exposed to prolonged cold snaps that impacted building, as well as ongoing supply chain and price pressures. However, a monthly jump in permits suggests new homebuilding is poised to maintain pace in the coming (warmer) months; housing starts still remain above the historical average of 1.5 million units per month.
Housing Starts, Permits & Completions
Privately-owned housing starts decreased 4.1 percent in January to a seasonally adjusted annual rate (SAAR) of 1.638 million units. Single-family starts were down 5.6 percent to a rate of 1.116 million units. Starts for the volatile multi-family segment were off 0.8 percent to a rate of 522,000 in January.
Privately-owned housing authorizations were up 0.7 percent to a rate of 1.899 million units in January, and single-family authorizations were up 6.8 percent to a pace of 1.205 million units. Privately-owned housing completions were down 5.2 percent to a SAAR of 1.246 million units. Per the US Census Bureau Report, seasonally-adjusted MoM total housing starts by region included:
- Northeast: +2.6 percent (+20.2 percent last month)
- South: -2.0 percent (-1.9 percent last month)
- Midwest: -37.7 percent (+36.5 percent last month)
- West: +17.7 percent (-13.8 percent last month)
Seasonally-adjusted MoM single-family housing starts by region included:
- Northeast: -25.8 percent (+11.1 percent last month)
- South: -4.7 percent (-8.2 percent last month)
- Midwest: -28.7 percent (+50.8 percent last month)
- West: +15.7 percent (-14.6 percent last month)

In December, the 30-year fixed mortgage rate jumped from 3.10 to 3.45 – the highest level in nearly two years – and the NAHB/Wells Fargo Housing Market Index (HMI) dropped by one point in mid-February to 82.
Market Trends
Looking more specifically at the single-family metric, after bottoming during the peak of the pandemic lockdowns in April 2020, single-family starts bounced back quickly before cresting in December. For most of 2021, this segment of the market trended downward amid high costs, supply chain strains and labor shortages. While single-family builds temporarily surged in November 2021, starts now appear to be succumbing to the same supply chain and cost pressures.
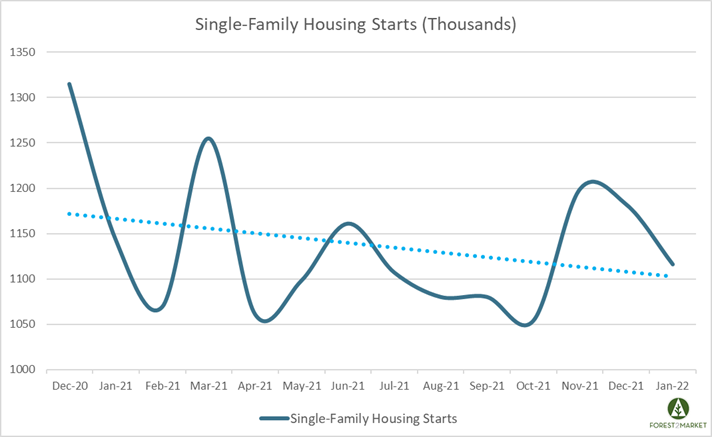
“While single-family starts dropped in January, the rise in permits, along with solid builder sentiment as measured in recent monthly surveys, suggest a positive start to the year given the recent rise in mortgage rates,” said NAHB chief economist Robert Dietz. “Fueled by higher mortgage rates and construction costs, declining housing affordability will continue to affect the home building market in 2022.”
Per fresh housing market insights published in our most recent issue of the Economic Outlook, homebuyers’ monthly mortgage bill will be significantly higher than it was a year ago. At current rates buyers can expect to pay $238 more per month on their mortgage (or nearly $3,000 per year) than they would have if they had bought property at this time in 2021. “This will hit first-time buyers especially hard, said Realtor.com’s George Ratiu, “and will shrink the budgets of what they can afford to buy—at a time when home prices continue to rise.”
“New home inventory is now more than three times higher, relative to sales, than inventory of existing homes, the biggest gap ever, by far,” observed Pantheon Macroeconomics’ Ian Shepherdson. “This position is likely to persist for several more months, at least, but homebuilders also will be closely watching how people respond to rising mortgage rates; a further surge in new home construction at this point looks risky to us.”
Zillow’s Jeff Tucker amplified on Shepherdson’s point when arguing that rising inflation/interest rates may support housing in the short run as buyers attempt to lock in the cost of their largest budget item; but demand will ultimately wane if wage increases fail to keep up with rising mortgage costs.


