
 Suz-Anne Kinney
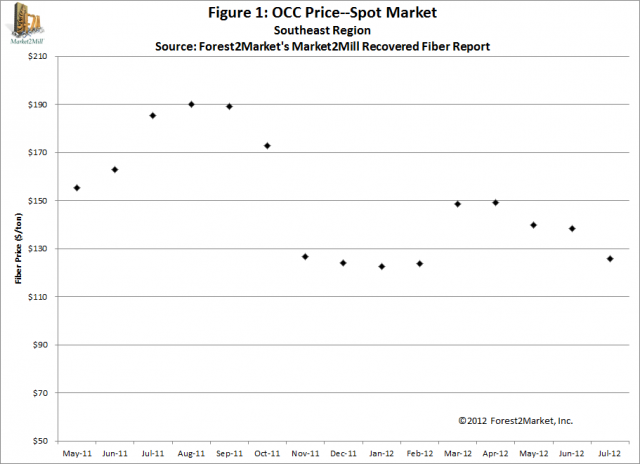
As human beings, we tend to shape our view of the world around the information we have. Figure 1 is a case in point. This graph shows the volume weighted average price for OCC in the Southeast region of the US for each month since Forest2Market began collecting recovered fiber data.
When we look at charts like this, we have a tendency to think that a single price point—say, May 2012’s $140/ton—represents the price for every ton of volume that moved in the market in the month. It also prompts us to believe that we should start the month of June buying or selling at or very near that price regardless of what supply and demand factors are operating in the market.
What these price points don’t show us, however, is our opportunities in the market, where we could have bought at a lower price or sold at a higher one. They tell us one of three things: either we’re average, below average or above average. Not exactly the kinds of terms we like to use to describe our own performance.
Survey-based market reports are especially bad in these circumstances. Because their methodology involves asking people—perhaps in person, perhaps via telephone call—what price they bought or sold at, the answers they return are far from precise. As a result, survey-generated reports generally describe market movements in increments of $5.
If we really thought about it, though, most of us would agree that the market doesn’t really work this way. As a buyer, if I can’t buy at $5/ton below reported price, I might be able to go $3/ton lower. Spread over 10,000 tons, that $3/ton can have significant impact on the bottom line. As a seller, if I can’t get $10/ton more, I might be able to get an additional $6.50/ton over average, increasing my margin. It’s these individual transactions, one by one, that make up the market. When prices are reported in $5 increments, opportunities to test the market and add to the bottom line are limited.
In reality, price is determined, not by a number produced via survey mechanisms by those who don’t buy or sell fiber, but by the individuals whose job it is—day in and day out—to make sure they get the best price they can whether they are buying or selling. This is how the market is built: transaction by transaction.
When each of those transactions is collected and then aggregated to describe the market, deeper insight is possible. Figure 2 is an example of how collecting and aggregating transaction level data can help us understand historical trends in the market so we can use this knowledge to make decisions going forward.
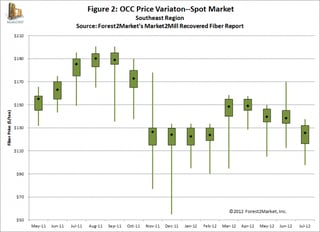
In Figure 2, the black diamonds are the volume weighted average monthly price for OCC (the same data points presented in Figure 1). The green boxes in this box-and-whisker plot contain the bulk of the market transactions—75 percent of all trades occurred within this price range. The remaining 25 percent is split between the two whiskers, with the entire upper whisker representing the highest priced 12.5 percent of all transactions and the bottom whisker representing the lowest 12.5 percent of all market transactions.
Market Volatility
What Figure 2 shows us is that market metrics that seek to predict future prices based on industry chatter tend to create artificial volatility. October and November of 2011 are a case in point.
The transaction data in October indicated that the market dropped $16/ton or approximately 8.5 percent, from an average of $189/ton in September to $173/ton in October. Seventy-five percent of all transactions in October occurred between the range of $165/ton and $180/ton. Only 12.5 percent of transactions occurred below the $165 mark. While the longer bottom whiskers in September and October indicate there was downward pressure on pricing, it was not nearly as bad as was later reported. A whopping 87.5 percent of the market traded above $165/ton during the month of October; just 12.5 percent fell below that level.
Because they reflect whatever sentiment is currently traveling around the industry, whether that is enthusiasm or—in this case—anxiety, survey mechanisms have a tendency to exacerbate price volatility. New price announcements at the beginning of November mischaracterized price movements in October and caused OCC prices to tank. They fell 26.5 percent in November to a volume weighted average of $127/ton. Seventy-five percent of the transactions fell between $115/ton and $130/ton. That anxiety continued to reverberate throughout the market in December (as the long bottom whisker suggests), though volume weighted average price fell just $3/ton to $124/ton, and 75 percent of transactions still fell between $115/ton and $130/ton. Again, just 12.5 percent fell below that level.
The question is, should 12.5 percent of the market—whether it is the top 12.5 percent (May-August 2011) or the bottom (September-December 2011)—continue to drive pricing decisions in the market? Again, I think most of us would agree that a volume weighted average price is a better indicator of where the market is.
The OCC market in 2011 is similar to the ones we’ve observed in other markets. If we go back to the origins of recovered fiber—to the buying and selling of pulpwood logs for paper and board production—we find the same patterns. Prior to the introduction of transaction-based pricing mechanisms, log markets were highly volatile in ways that could not be explained by the laws of supply and demand. Once market profile information based on a volume weighted price of thousands and thousands of data points (or transactions) was available, however, that was no longer the case.
What can we learn from the events that transpired in the OCC market in 2011? Simply this: artificial price volatility is detrimental to the market. Sometimes it will advantage sellers, as it did in the May-September 2011 timeframe, and sometimes it will advantage buyers, as it did in October-November 2011. Regardless of whether you are a buyer or a seller, however, the ramifications of this type of volatility are serious:
- Making forward looking business decisions becomes incredibly difficult when price is no longer a function of supply–demand interaction.
- A facility’s margins can be wiped out without a valid market-based reason. The $40/ton increase that occurred from May-August of 2011 squeezed mill margins in the same way that November 2011’s precipitous drop shocked supplier margins. No matter how much hard work and capital a facility invests in operational improvements to increase its margins, volatility can nullify these investments without warning.
- Capital investors avoid altogether or demand high rates of return when investing in markets that appear highly volatile and arbitrary precisely for this reason.
To ensure that recovered fiber markets are both competitive and efficient, owners and managers need to be able to make fact-based decisions that protect and improve facility margins. The more confidence decision makers have in the data they use, the more confidence they can have in their decisions. And when decision makers have more confidence in their decisions, they can take aggressive action to spur better performance and growth.
What might this less volatile market look like? The 2012 data in Figure 2 shows that the market has followed a more reasonable pattern since the 2011 reset, with the weighted average moving between $125/ton and $150/ton, a range more in keeping with actual supply and demand events in the market, such as the expected spring slowdown in generation levels.
Measuring Performance
So, here’s another human truth. Everyone’s performance is being measured all the time, whether formally or informally. There is no avoiding it. As bosses, colleagues, competitors, even spouses, parents and friends, we have expectations for ourselves and those around us, and we occasionally get out our yardsticks and ask how well we or they are measuring up.
We have a tendency to measure ourselves against the closest yardstick. Let’s go back to Figure 1, for instance, if July’s average was $126/ton, and I sold at $126/ton, I would know I was average. If July’s volume weighted average is $126/ton and I sold at $132/ton or bought at $116/ton, I would feel pretty good about myself. But what if I sell at $116/ton or buy at $132/ton when the market average is $126/ton? Would that mean that my performance was sub-par? Maybe. And maybe not.
In order to tell, we would need Figure 2, a transaction-by-transaction picture of all trades that occurred in the market during a particular month. In July 2012, according to Figure 2, 75 percent of all trades were transacted in the $116-$132 range. So even if I sold at $116 or bought at $132, my performance was still in line with the majority of the market.
But what if my performance ends up on one of the whiskers? If I sold in the upper whisker or bought in the lower one, my manager might reward me as a way of encouraging me to repeat this performance and perhaps incent others to follow suit. For instance, in June of 2012, if the market average was $138/ton and I sold 10,000 tons of OCC at an average cost of $144/ton, I would have made my company an additional $60,000. Because it provides the ability to track actual returns, management can use a transaction based tool to identify and recognize stellar performance.
If, on the other hand, I’m a buyer whose performance ends up in the upper whisker or a seller who ends up in the bottom whisker for three months in a row, I would expect to sit down with my manager and develop a specific set of performance goals to help me get back on track. And my manager would be expected by his or her boss to hold me accountable for those goals.
As a tool, transaction-based market information allows for the identification of performance improvement opportunities. In addition, it can provide a mechanism for determining whether performance objectives have been met and how they have affected the bottom line.
Transaction-based market data has a much broader application as a performance management tool as well. It can be used at the corporate level to identify opportunities at the facility level and at the facility level to identify opportunities at the management level. And it can also be used by corporate to improve relationships with investors. If I can demonstrate to my boss, ownership or investors that I have outperformed the market on a regular basis, I’ll have a lot more autonomy going forward.
Of course, this type of performance management system is only possible when the yardstick being used is credible, auditable and objective. No one should agree to be measured by a yardstick based on anecdotes. Anecdotes are not statistics.
Running a successful and profitable business is more difficult and complex than ever. Tools that might have served us in the past may no longer be relevant or useful. As technology improvements make it possible to operate more efficiently and data management software provides the ability to harness real data and apply it to our business decisions, we will need to move beyond bad market information. Only then will we move beyond average.


