
 Suz-Anne Kinney
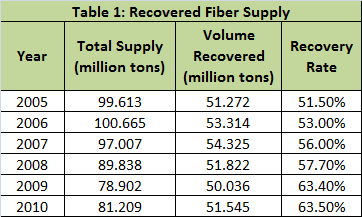
The recovery rate for recycled fiber has been increasing steadily, from 51.5 percent in 2005 to 63.5 percent in 2010. Just because recovery rates are going up, however, it doesn’t mean that the volume of recovered fiber being generated is also increasing. Let’s look at the numbers. In addition to the recovery rate, Table 1 shows the total supply of paper and the total volume of that material recovered from the waste stream. What these numbers demonstrate is that total supply has fallen during the recession. Because the recovery rate has been going up, however, total recovered fiber generation has remained relatively flat. Why is this?
The volume of total supply and the subsequent volume of fiber that is actually recovered in any given year are affected by three primary factors: the state of the economy, the technology advancements and the affect of these advancements on consumption of paper and paper products, and weather-related events that affect logistics. I’ll focus specifically on the economy here.
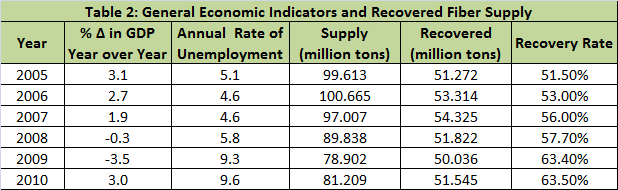
Whenever general economic indicators like gross domestic product (GDP) drops and unemployment rates increase, the data shows that the total supply of paper available for recovery also drops. When we add these two indicators to the above table, this correlation is clear (Table 2). As GDP moves into negative territory in 2008 and unemployment starts to climb, the supply of fiber drops to 89.8 million tons; as GDP drops further in 2009 and unemployment skyrockets, the fiber supply drops another 10 million tons to 78.9 million. Had recovery rates stayed the same throughout this period, a shortage of recovered fiber would have ensued.
Another economic factor that affects generation of recovered fiber is real estate. Table 3 shows that overall performance in the real estate market continued to weaken in September. Performance in real estate affects generation in numerous ways. First, if the rate of home sales decreases, banks are not making loans, and the amount of office paper that is generated in support of loans is greatly reduced. In addition, new home sales (and many existing home sales) mean new appliances with all the packaging that that entails. Home sales are also a catalyst for the purchase of a whole range of home goods that require both paperwork and packaging. When new home sales fall from 1.5 million per year to .5 million per year, generation is severely restricted.
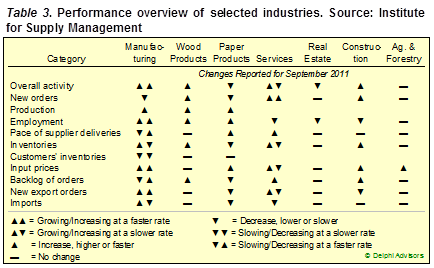
Manufacturing (also represented in Table 3) also shows mixed performance; new orders, for instance, were down in September, though some of the other indicators improved since August. Because robust manufacturing activity also determines the volume of material available for recovery, a slowdown on this front can have serious ramifications for generation levels.
The commercial occupancy rates also have a significant impact on generation. A majority of recovered office paper is supplied by commercial entities that use high volumes of office paper. When the commercial occupancy rate goes down, this portion of supply restricts as well.
Other economic factors that influence generation and round out the story are consumer spending and retail sales. Drops in these areas limit generation as well. The paper and paper products industry has fared relatively well throughout the recession and the subsequent meager recovery. The Institute of Supply Management reports that orders and over activity in the industry slowed in September, while mill inventories shrank and production increased (Table 3). Despite these month to month fluctuations, we expect that fiber generation will remain status quo until a stronger economic recovery occurs.


