Forest2Market is now beta testing Timber Supply Analysis 360 (slated to become available at the beginning of November), an interactive tool that provides fast, streamlined access to the USFS Forest Inventory and Analysis data on growth, inventory and harvests. It also provides access to harvest data in the Pacific Northwest from the Bureau of Business and Economic Research (BBER), Oregon Department of Forestry (ODF) and the Washington Department of Natural Resources (WADNR). Timber Supply Analysis 360 is the only tool that allows you to access all of this data in one place.
The data in these maps and charts has been filtered to show growth and removals data for private acreage only and for predominant species.
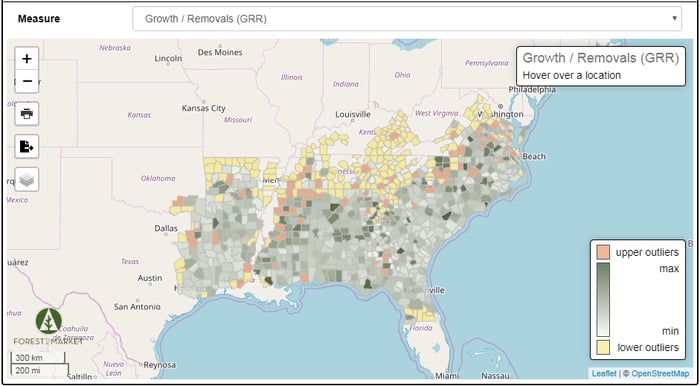
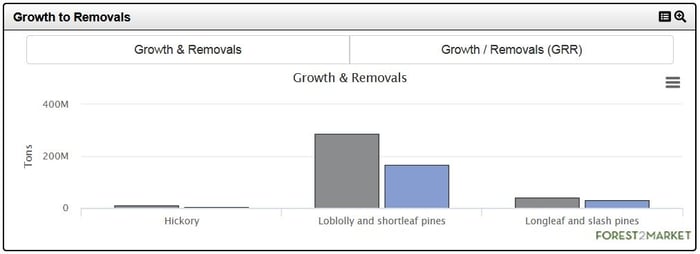
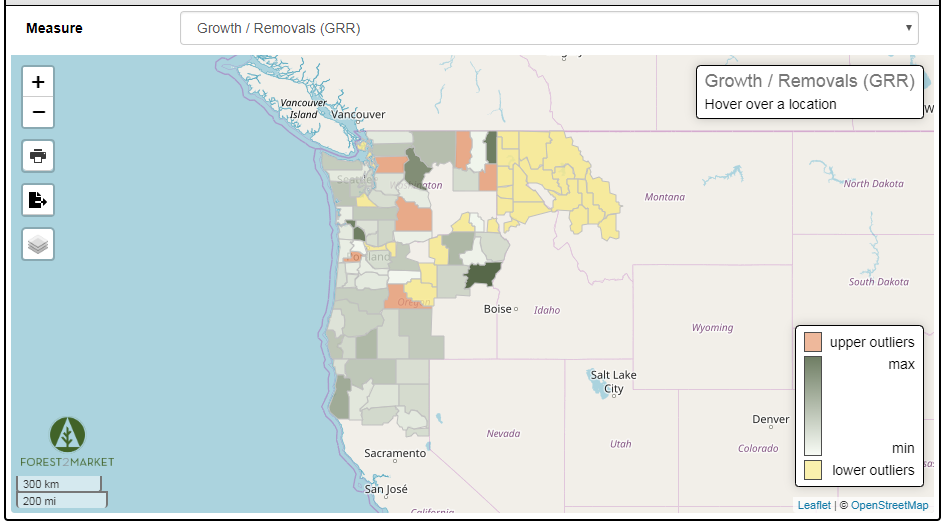
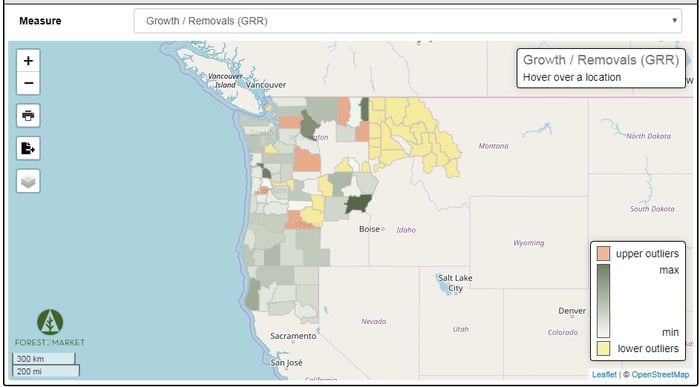
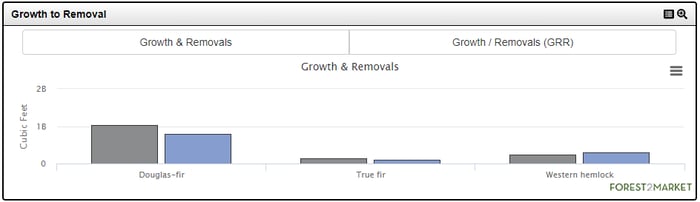
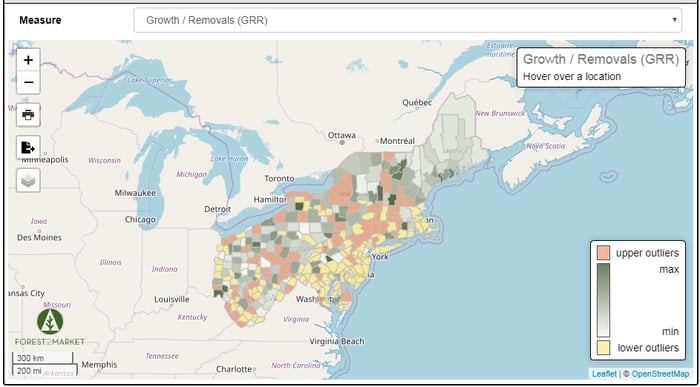
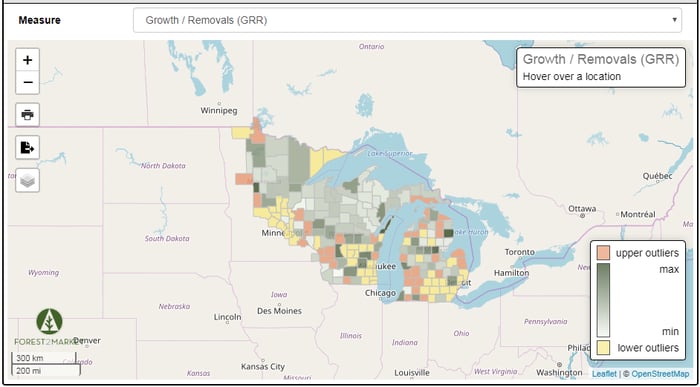
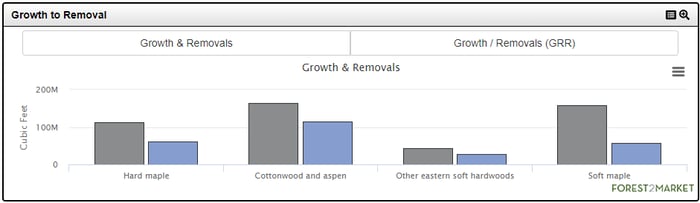
The following color-coded heat maps distinguish between high and low growth-to-removals ratios, while the charts below the maps show growth and removals for the predominant species.
Pacific Northwest
Northeast
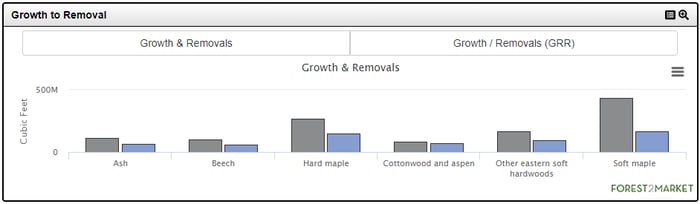
Lake States
US South