
 Joe Clark
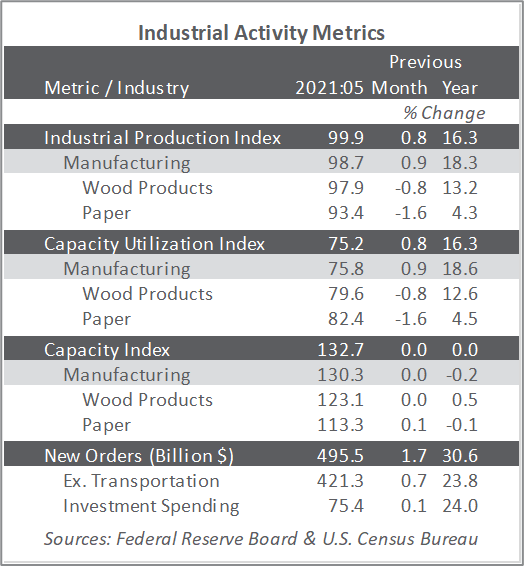
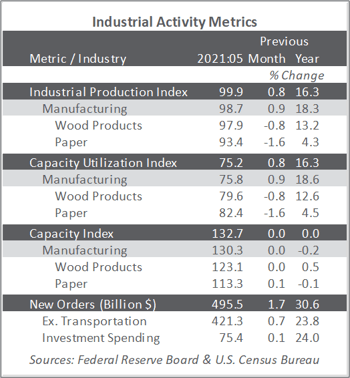
US forest industry performance in May and June was recently reported by both the US government and the Institute for Supply Management.
Total industrial production (IP) increased 0.8 percent in May (+16.3 percent YoY, but 1.4 percent lower than its pre-pandemic level). Manufacturing production advanced 0.9 percent, reflecting, in part, a large gain in motor vehicle assemblies; factory output excluding motor vehicles and parts increased 0.5 percent. The indexes for mining and utilities rose 1.2 percent and 0.2 percent, respectively.
New factory orders increased 1.7 percent; excluding transportation: +0.7 percent. Oddly, given claims by MarketWatch.com’s Jeffry Bartash and others that “companies have been investing more in preparation for a post-pandemic world,” business investment spending inched up by only 0.1 percent. We find it a bit puzzling to read “part of that spending includes more automation” in an environment of semiconductor shortages.
The Institute for Supply Management’s (ISM) monthly sentiment survey showed a slight decrease in the proportion of U.S. manufacturers reporting expansion in June. The PMI registered 60.6 percent, a dip of 0.6PP from the May reading. (50 percent is the breakpoint between contraction and expansion.) The sub-indexes for imports (+7.0PP), order backlogs (-6.1PP) and input prices (+4.1PP) exhibited the largest changes.
The services sector also retreated (-3.9PP, to 60.1 percent) from May’s all-time high of service-sector respondents reporting expansion. The most noteworthy changes in the sub-indexes included exports (-9.3PP), imports (+7.8PP) and employment (-6.0PP).
Findings of IHS Markit’s June survey results were generally consistent with their ISM counterparts. “June saw another month of impressive output growth across the manufacturing and services sectors of the U.S. economy, rounding off the strongest quarterly expansion since data were first available in 2009,” Markit’s Chris Williamson said. “The rate of growth cooled compared to May’s record high, however, adding to signs that the economy’s recovery bounce peaked in 2Q.
“Some of the easing in the rate of expansion reflects payback after especially strong expansions in prior months as the economy opened up from pandemic-related restrictions, especially in consumer-facing companies. However, many firms reported that business activity had been constrained either by shortages of supplies or difficulties filling vacancies. Backlogs of uncompleted orders are consequently rising at a rate unprecedented in the survey’s history, underscoring how demand is outstripping supply of both goods and services.
“These capacity constraints are not only stifling growth, but also driving prices sharply higher. June saw the second-steepest rise in average prices charged for goods and services in the survey’s 12-year history, though some encouragement can be gleaned from the rate of inflation easing in the service sector compared to May.”
The consumer price index (CPI) increased 0.6 percent in May (+5.0 percent YoY—the largest YoY rise since August 2008’s +5.4 percent). The index for used cars and trucks continued to rise sharply (+7.3 percent) and accounted for about one-third of the headline MoM increase. The food index increased 0.4 percent, the same increase as in April. The energy index was unchanged in May, with a decline in the gasoline index again offsetting increases in the electricity and natural gas indexes.
Meanwhile, the producer price index (PPI) increased 0.8 percent (+6.6 percent YoY). Nearly 60 percent of the May increase in the index for final demand can be traced to a 1.5 percent rise in prices for final demand goods, led by nonferrous metals (+6.9 percent). The index for final demand services moved up 0.6 percent, led by auto retailing (+27.3 percent).
In the forest products sector, price index performance included:
- Pulp, paper & allied products: +1.6 percent (+8.4 percent YoY)
- Lumber & wood products: +9.5 percent (+48.7 percent YoY)
- Softwood lumber: +20.6 percent (+154.3 percent YoY)
- Wood fiber: -0.7 percent (+9.9 percent YoY)


