 Joe Clark
US forest industry performance in September and October was recently reported by both the US government and the Institute for Supply Management.
Total industrial production (IP) fell back 0.4 percent (-0.1 percent YoY) in September after advancing 0.8 percent in August. For 3Q, IP rose at an annual rate of 1.2 percent following declines of about 2 percent in both 1&2Q. Manufacturing production decreased 0.5 percent in September, with output reduced by the strike at General Motors. Excluding motor vehicles and parts, the overall index and the manufacturing index each moved down 0.2 percent. Mining production fell 1.3 percent, while utilities output rose 1.4 percent.
New orders decreased 0.6 percent (-2.4 percent YoY). The GM strike had only a modest effect on new orders in September: Motor vehicle bodies, parts and trailers comprised less than one-tenth the $2.4 billion drop in transportation equipment-related orders. Business investment spending fell by 0.6 percent (0.0 percent YoY).
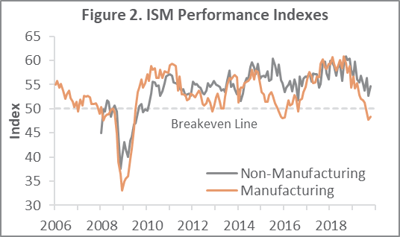
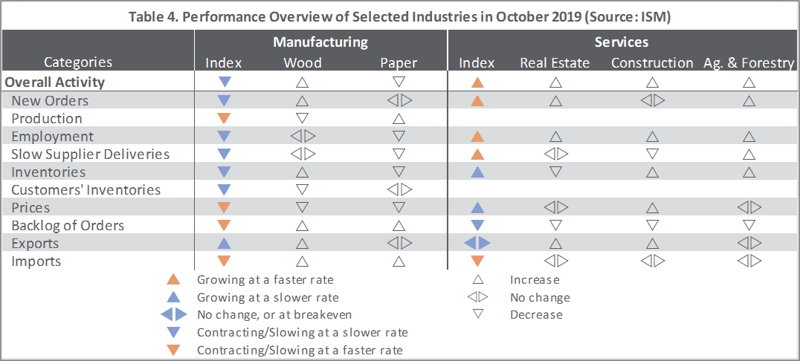
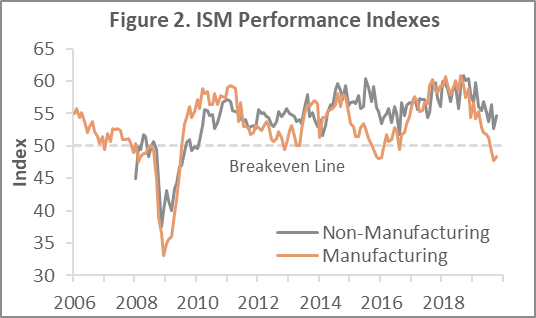
The Institute for Supply Management’s (ISM) monthly sentiment survey showed that in October, US manufacturing contracted at a marginally slower pace. The PMI registered 48.3 percent, up 0.5PP from September, but still below the 50 percent threshold that signals contraction. Notable changes in the sub-indexes included a +9.4PP turnaround (although barely back into positive territory) in exports and a drop in input prices (-4.2PP). The pace of growth in the non-manufacturing sector accelerated (+2.1PP, to 54.7 percent). Drivers behind that rise were concentrated in new orders (+1.9PP) and employment (+3.3PP). Of the industries we track, only Paper Products contracted. Respondent comments included the following:
- Construction: “Current outlooks for commodities, equipment, and materials indicate purchasing now has leverage. Investment is still hampered by uncertainties in trade, global economic environment, manufacturing and the like.”
- Real Estate: “Business remains brisk and well ahead of last year to date, as we near the peak of our busiest season. Looking ahead, our customers remain upbeat about their business well into next year.”
- Paper Products: “Trade cost pressures continue to be a headwind in our business.”
Findings of IHS Markit’s October surveys were mixed relative to their ISM counterparts, but the overall conclusions were similar: the US economy remains somewhat fragile.
The consumer price index (CPI) was unchanged in September (+1.7 percent YoY) after rising 0.1 percent in August. Increases in the indexes for shelter and food were offset by declines in the indexes for energy and used cars and trucks (-1.6 percent). The energy index fell 1.4 percent as the gasoline index declined 2.4 percent. The food index increased 0.1 percent in September after being unchanged in each of the prior 3 months.
For the producer price index (PPI), meanwhile, “domestically generated inflationary pressures remain fairly subdued,” said Capital Economics’ Andrew Hunter. The PPI decreased by an unexpected 0.3 percent in September (but +1.4 percent YoY)—the biggest MoM headline drop since September 2015. A combination of declines in the indexes for machinery and vehicle wholesaling (-2.7 percent) and gasoline (-7.2 percent) comprised the majority of the PPI’s retreat.
In the forest products sector, index performance included:
- Pulp, Paper & Allied Products: -0.3 percent (-1.8 percent YoY)
- Lumber & Wood Products: 0.0 percent (-3.7 percent YoY)
- Softwood Lumber: +2.0 percent (-8.7 percent YoY)
- Wood Fiber: -0.3 percent (-4.9 percent YoY)