US housing starts dropped unexpectedly in July as new construction of single- and multi-family homes declined. The recent report from the US Census Bureau also showed a decline in building permits, which suggests that residential construction might continue its struggle after tightening in the second quarter. As the peak building season comes to a close, this latest data could temper expectations of a rebound in housing market activity in 3Q and 4Q2017.
Housing Starts, Permits & Completions
US housing starts dropped 4.8 percent to a seasonally adjusted annual rate (SAAR) of 1,155,000 units in July. Single-family starts accounted for 856,000 units, which is 0.5 percent below the revised June figure of 860,000. Starts for the volatile multi-family housing segment dropped 15.9 percent to a 299,000 unit-pace.
Privately-owned housing completions were 6.2 percent below June’s estimate of 1,252,000 units. Single-family permits were unchanged at a rate of 811,000 units, while multi-family permits plunged 11.2 percent. Regional performance in July was similar to June’s numbers with the exception of a notable drop in the US West, as confirmed by the US Census Bureau report. Seasonally-adjusted, single-family housing starts by region included:
- Northeast: +9.8 percent (+9.3 percent last month)
- South: +2.0 percent (+7.2 percent last month)
- Midwest: -7.4 percent (-3.6 percent last month)
- West: -4.3 percent (+10.6 percent last month)
Mortgage Rates & Market Sentiment
The 30-year fixed mortgage rate was unchanged at 3.9 percent, and the National Association of Home Builders (NAHB)/Wells Fargo builder sentiment index jumped four points to 68 in early August.
“The fact that builder confidence has returned to the healthy levels we saw this spring is consistent with our forecast for a gradual strengthening in the housing market,” said NAHB Chief Economist Robert Dietz. “GDP growth improved in the second quarter, which helped sustain housing demand. However, builders continue to face supply-side challenges, such as lot and labor shortages and rising building material costs.”
Homebuilding Trends & Data
An in-depth report that was recently released by online real estate marketplace, Trulia, notes that just a handful of metro markets are really driving the homebuilding gains we have witnessed in 2017. It also examines the ripple effect that homebuilding has on a community’s economy, including job and home inventory growth.
Trulia says, “Homebuilding matters more than you might think. Not only are newly built homes a source of new home inventory as well as construction jobs, they also help increase existing inventory through a chain-reaction effect: buyers of new homes often sell their existing one, which frees up a home for someone else, who in turn decides to buy it and sell their home, which then becomes a home for a first-time homebuyer. In fact, last month we found that new homebuilding was the single best predictor of home inventory in the U.S.”
Trulia then asked the obvious question: why are some markets hot and others not? The report found that:
- Homebuilding activity varies widely among the largest metros. Dallas, Houston, and New York are each on pace to build more than 40,000 new homes each this year, while Worcester, Mass., New Haven, Conn., and Allentown, Pa., are pace to build less than 500 each.
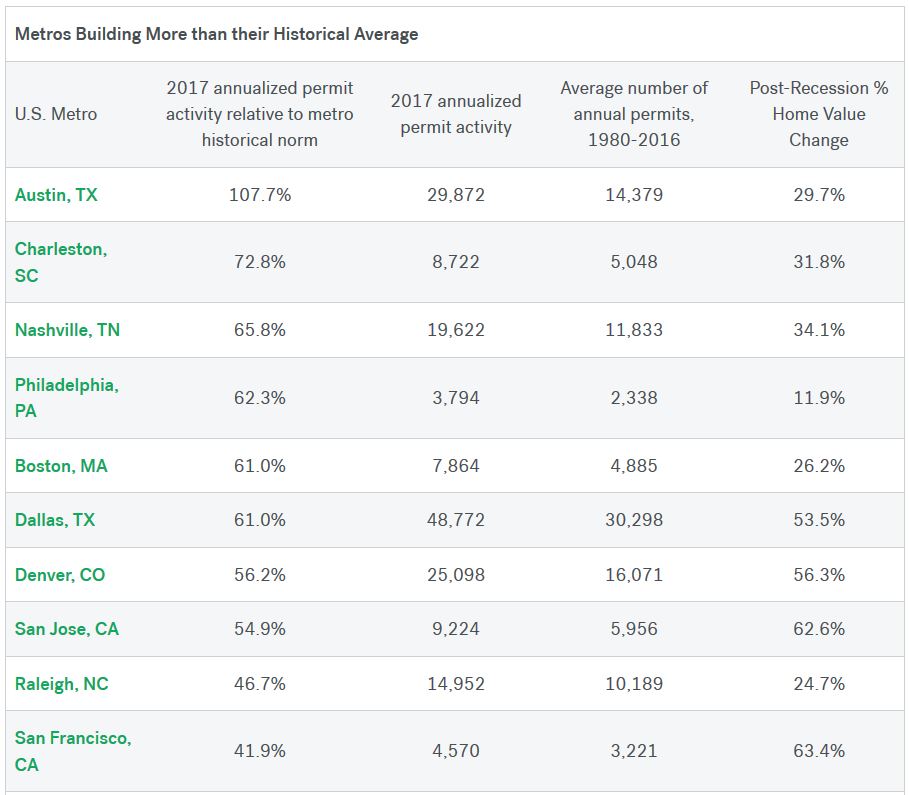
- Markets that are building much more than their historical average are mostly in the South: Austin, Texas, Charleston, S.C., and Nashville, Tenn., are on track to finish 2017 having approved 107.7%, 72.8%, and 65.8% more residential construction than their historic average.
- Markets that are building much less than their historical average are mostly in the North: Worcester, Allentown, and New Haven are on track to finish 2017 having approved just 85.5%, 85%, and 80.8% fewer homes than their historic average.
- Strong job growth, increasing wages, and home value growth explain much of the difference between metros that are building more than their historical average and metros that aren’t.

Source: Trulia, Inc.
Through their research, Trulia found that the factor with the largest impact on homebuilding is job growth. Job growth is not only vital for supporting a healthy housing market, but also for supporting healthy homebuilding and home values. “Jobs provide a steady source of income that lenders usually require as a condition of financing. So, more jobs lead to more demand for homes, which in turn supports new homebuilding activity. Across the largest 84 metros, every percentage point increase in a market’s job growth between 2010 and 2016 is, on average, correlated with homebuilding that is approximately 5% higher. For example, if the Charleston, S.C., metro area had experienced job growth of 16.9% instead of 15.9% between 2010–2016, we could have expected their 2017 homebuilding activity to be 77.9% above their historic average instead of 72.9%.”
Even with steady job and income growth in a handful of these booming markets, national homebuilding data continues to disappoint. The US South has experienced a wetter-than-average summer, which could account for the modest gains seen in this region. But a temporary monthly jolt is unlikely to solve the underlying problem that we touched on in June—namely, an undersupply of new, affordable starter homes on the market.
Stephen Stanley, chief economist for Amherst Pierpont Securities, noted that “Anecdotal reports point to a widening chasm between the entry-level market, which is red-hot with inadequate supply, and the luxury market, where there are huge gluts of overpriced homes in many areas. Builders will have to figure out how to make money building starter homes to balance that equation, and that seems to be where we are headed.”