
 Suz-Anne Kinney
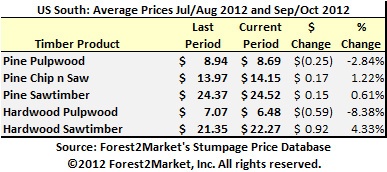
Forest2Market collects data about timber sales in the US South from timber sales agreements. As a result of the breadth and depth of this data, we can provide highly accurate and local timber prices. For buyers and sellers of timber, the importance of having local prices cannot be overstated. Let's compare, for instance, the difference between the average sawtimber and pulpwood prices for the entire US South with the average numbers for three regions in the South: East-South, Mid-South and West-South.
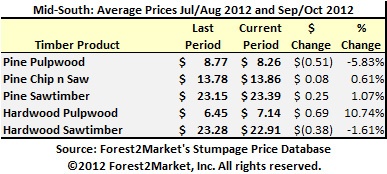
In the table that follows, average prices for the current 60-day period (September/October 2012) are compared to those of the last period (July/August 2012). Please note: all prices are $/ton; any discrepancies are due to rounding errors.
Across the South, sawtimber classes increased in price and pulpwood prices fell in September/October. In addition, hardwood classes exhibited more volatility than did pine prices.
While this information is useful for getting a general sense of the market, it is important to note that the story can be much different when we look at prices in smaller regions.
East-South
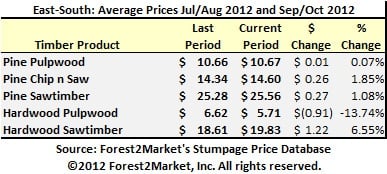
The following table outlines prices in the East-South region for September/October and compares them to their counterparts from the July/August timeframe.
Similar to the southwide results, pine prices are stable and hardwood prices are volatile. Unlike the southwide numbers, however, pine pulpwood prices remained steady. In addition, due to the nature of East-South timber markets, pine generally brings a higher price than the southwide average and hardwood usually brings a lower price than the southwide average.
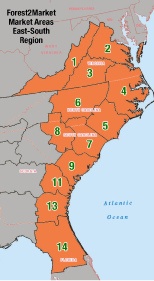
If we drill down even future and look at prices in the 10 micromarkets or wood basins that make up the East-South (micromarkets are indicated by numbers on the map), we see further differences in price. The following table shows the difference between the wood basin with the highest average price and the one with the lowest average price for the September/October reporting period.
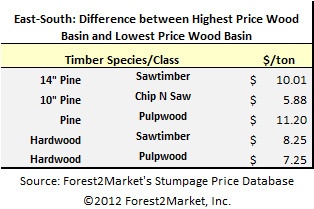
As this table indicates, the variation in price between one wood basin and another can be wide. Using a highly generalized price, like a regional or even a statewide average, can mean thousands of dollars are left on the negotiating table.
Mid-South
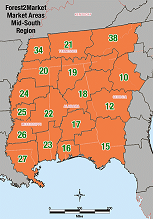
Moving in opposite directions than the rest of the South, Mid-South hardwood sawtimber prices increased in the September/October timeframe and hardwood pulpwood price decreased. In addition, pine pulpwood prices exhibited a higher degree of volatility.
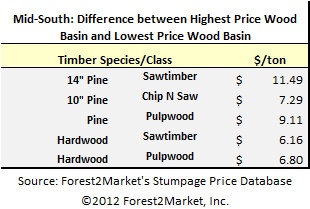
As in the East-South, prices in the 18 wood basins in the Mid-South region varied significantly. This table shows the difference in price between the wood basin with the highest prices and the one with the lowest and highlights the importance of having local timber prices when negotiating timber sales agreements.
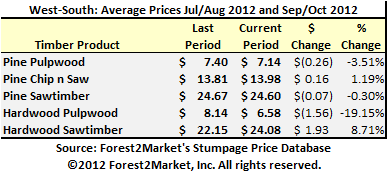
West-South
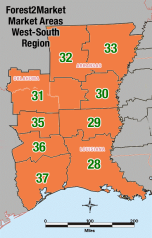
Prices in the West-South are most closely aligned with the southwide numbers, though the volatility in hardwood prices is more extreme.
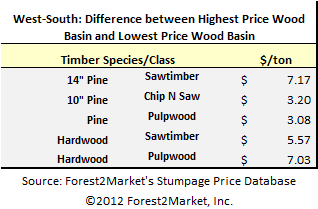
The variability in prices between wood basins (there are 9 in this region) can be found in the following table. As the table shows, the variations in price among the region's wood basins tend to be less extreme than in the East-South and Mid-South regions. However, when spread across just 2,000 tons of pine pulpwood, a $3.00/ton difference can add up to an extra $6,000 in revenue or savings.
Learn more about local timber prices:


