1 min read
Wood fuel prices have remained virtually unchanged over the last three quarters ending at an average of $19.75 per ton in 1Q2017. The market is on a flat to improving trend as prices for substitute energy sources (i.e. natural gas and electricity) have begun to move in opposite directions and as recent supplies of wood fuel have increased. Purchasers continue to take advantage of the situation by keeping delivered prices depressed.
On the supply side: Supplies of sawmill residues have remained steady since 1Q2016 as the lumber market has continued to improve. This has also resulted in more harvest activity and an increase in the available supply of harvest residues.
On the demand side: Beginning in 2Q2016, prices for natural gas began to increase, while industrial electricity prices continued to decrease. Industrial electricity fell 4.9 percent over 4Q2016 and 1Q2017 (compared to 2Q and 3Q2016) while natural gas prices increased 33.2 percent.
The result of this supply-demand effect: When compared to 2Q and 3Q2016, purchasers made the most of the available supply by increasing their open-market purchases by 4.4 percent in 4Q2016 and 1Q2017. When compared to 3Q2016, wood fuel prices in 4Q2016 were largely unchanged at an average of $19.71 per ton, and they have demonstrated a slight increase of $0.04 to average $19.75 per ton in 1Q2017.

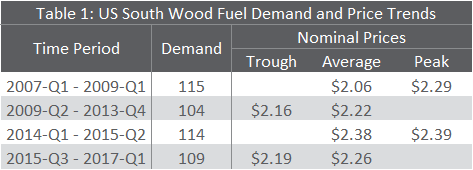
Figure 1: Wood fuel demand and price fluctuations, 2006 - 1Q2017
A deeper look at the data behind this chart shows four distinct trends, which are enumerated in Table 1. Demand for wood fuel was significantly lower during the Great Recession of 2008 and the post-recession years, and the price for wood fuel dropped as low as $2.16 per million BTUs. During the last seven quarters, as demand has weakened, prices have fallen to an average of $2.26 per million BTUs.
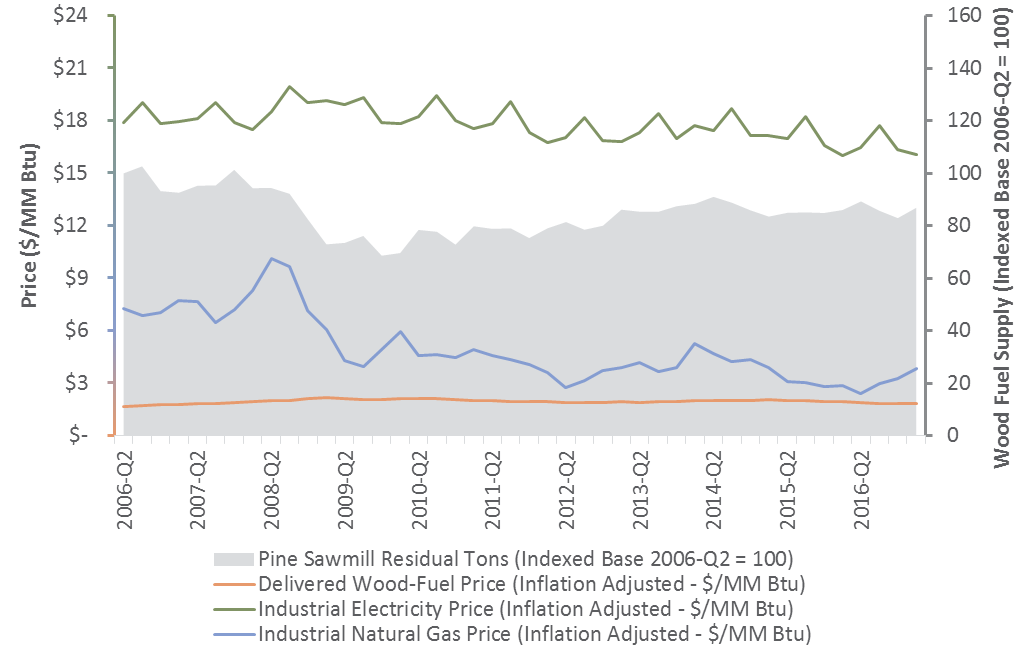
How does this compare to other energy prices? Figure 2 shows the price fluctuations in natural gas and electricity prices during the same four time periods. Supply in this chart is indexed to the supply of sawmill residuals in 2Q2006.

Figure 2: Energy price fluctuations, 2006 - 1Q2017
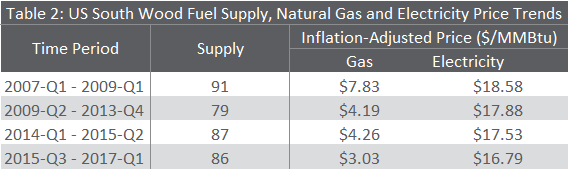
Table 2 highlights the trends in the wood fuel supply and energy prices for the same four time periods. The trend for the period between 2Q2009 and 4Q2013 reflects the fact that production at sawmills was dramatically lower than the historical norm, a result of anemic housing start activity. By the last half of 2016, prices for natural gas and electricity were moving in opposite directions. Natural gas prices are currently trending upwards.