 Pete Coutu
This is the second installment of the two-part series on identifying opportunities for supply chain improvements within the forest products industry. The material is taken from a presentation I delivered at the Forest Resource Association (FRA) Lake States annual fall meeting in October, 2015.
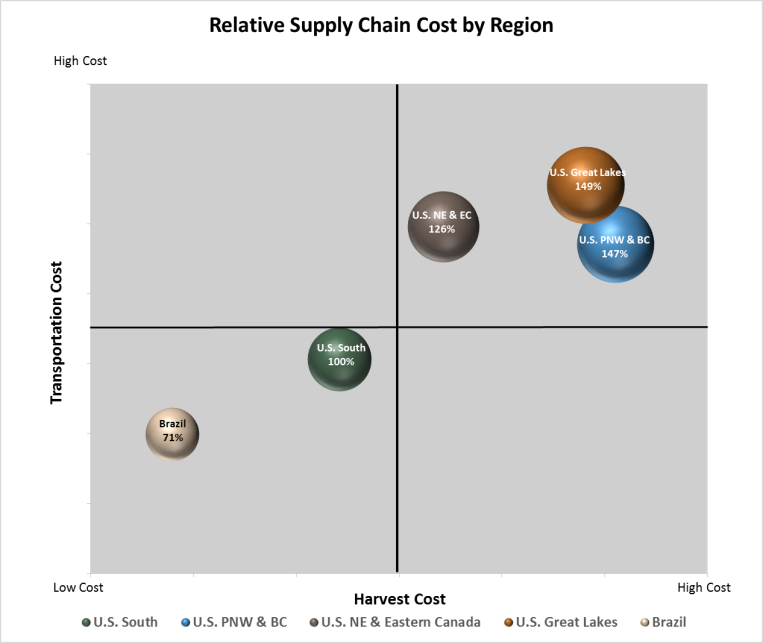
In the first part of this series, I discussed the basics of supply chain logistics for the forest products industry, as well as some of the additional relative costs by region. As I broke down these costs and began to compare them by area, it became apparent that some of the high-level views simply weren’t telling the entire story. For instance, while the elevated view of Brazil’s preferred harvesting and transportation methods did not appear to be as cost effective as methods used in the US South, average payloads were 32% higher and the average haul distance was 10% shorter. This case very clearly illustrated the importance of relying on high-quality data when analyzing supply chain components. As noted in the graph below, Brazil’s relative supply chain costs are substantially lower than those in other regions. So, how do we uncover these fine points and develop new opportunities for maximizing profit? The answer starts with the use of superior datasets.

Tools of the Trade
Regional Benchmark
The process of analyzing the various components of the supply chain begins with establishing an appropriate peer group and determining a sample mill’s current market position within that group, and this can only be done with accurate data. The Delivered Benchmark is the starting point for this high-level view; in the graph below, which measures softwood total wood fiber costs within this mill’s region, notice that our sample mill (the orange bar) falls roughly in the middle of this particular peer group.

While this mill is pretty much in line with the group weighted average, Mill 1 is substantially outperforming it. They are paying more than $17 less per ton than the sample mill is paying. Just imagine the savings when analyzing quarterly and yearly wood costs. What’s going on here? How can Mill 1 be paying 31 percent less than the sample mill is paying for the same products in the same region?
Best in Class Analysis
The answers to this question can be exposed by looking at more detailed data. The next step is to look at individual supply chain components and their associated costs. Note that in the graph below our sample mill again falls pretty near the middle of the pack. This view provides much more detail about the performance of the sample mill in its peer group; not only do we get to see overhead, freight and fiber costs by individual mill, but we’re also able to see average haul distances and product consumption percentages. This data allows us to identify advantaged mills in the region, as well as the precise areas in which they are advantaged. For example, notice the overhead $/ton cost for Mill 3 is more than 400 percent higher than Mill 2. Simply reigning in this cost component would create substantial savings and allow Mill 3 to slide into the number two position.

Cost Curves
As we continue to drill down into other powerful analytical tools, cost curves provide another view that will help us identify where the sample mill is outperforming and underperforming the market. From this view, we are able to identify the exact areas of underperformance. As illustrated in the graph below, our mill is paying a premium for the final tons delivered within this timeframe; this data helps identify a specific area that needs improvement so we can fine-tune the modifications rather than playing a guessing game. How? By identifying the exact scale tickets that make up the highest cost tons, high cost suppliers, poorly performing supply agreements and extraordinarily long haul distances, which can either be renegotiated or removed from the procurement system.

Market Share Analysis
As we begin to identify problem areas from the data we have examined thus far in the process, a market share analysis will help us further develop and implement appropriate strategies rather than presumptive quick-fixes. By identifying the percent of available volume a mill is purchasing in a particular county or zone, the market share analysis will allow us to:
-
Analyze performance by county, by zone or on a customized basis
-
Identify areas of procurement strength
-
Shift procurement to lower cost areas where supply is available
-
Limit purchases from high cost areas
-
Identify actual volume that will shift to lower cost areas/sources and at what price
-
Identify price outliers

Dashboards
Together, these tools provide clear direction for implementing cost-saving strategies across the sample mill’s supply chain. With them, the sample mill can take decisive action based on the best available data. One final tool, the dashboard component of our supply chain optimization program, provides a means to measure quarter over quarter and year over year performance within the market across a multi-mill system; dashboards provide a snapshot of asset performance and allow mills to easily track multiple mill costs and inventories across regions.
In the graph below, note that Mill A is currently paying $1 per ton above market cost, which equates to $268,000 above market cost over the specified timeframe. Annually, this would equate to over $1 million to the bottom line, and controlling this cost would go a long way towards improving profitability. This dashboard view provides mills with the actionable data to quickly see areas in which they are disadvantaged; from here, it’s much easier to make practical adjustments as needed to adapt to changes in the market, inventory levels, etc.

As we noted in a recent piece on lean manufacturing and Kaizen, the process of continual improvement is imperative if mills are going to gain a competitive edge in the marketplace. Supply chain characteristics in the forest products industry are complex and demand meticulous attention to detail to remain competitive and profitable. Forest2Market’s Supply Chain Optimization program is the most comprehensive tool available in the industry to uncover inefficiencies, implement the right solutions and measure the results. Harnessing the power of transactional data grants us access to a granular view of supply chain components, and this provides a foundation for continual improvement and profitability.