
 Joe Clark
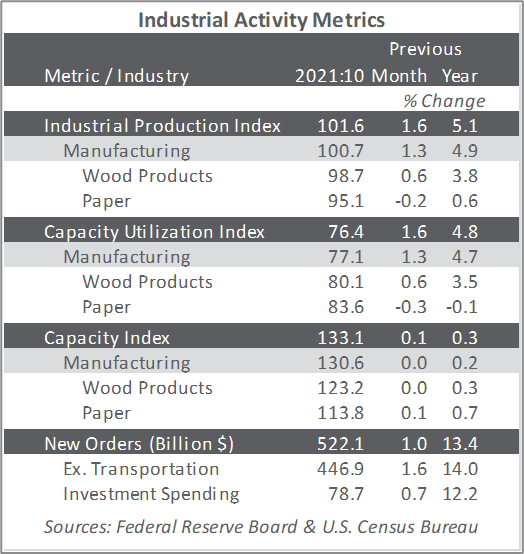
Total industrial production (IP) rose 1.6 percent in October (+5.1 percent YoY, and at its highest reading since December 2019) after falling 1.3 percent in September; about half of October’s gain reflected a recovery from the effects of Hurricane Ida. Manufacturing output increased 1.2 percent in October; excluding a large gain in the production of motor vehicles and parts, factory output moved up 0.6 percent. The output of utilities rose 1.2 percent, and mining output stepped up 4.1 percent.
Factory new orders increased by 1.0 percent in October, led by nondurable goods. Excluding transportation, which fell 2.6 percent, new orders rose by 1.6 percent MoM. Business investment spending advanced by 0.7 percent (+12.2 percent YoY). Although manufacturing definitely remains constrained, there are suggestions supply chain challenges may be starting to ease a bit. Growth in the value of unfilled orders slowed to +0.3 percent in October while shipments hit +2.0 percent (from +0.7 percent and +1.0 percent, respectively, in September).
The Institute for Supply Management’s (ISM) November sentiment survey showed a slight increase in the proportion of US manufacturers reporting expansion. The PMI registered 61.1 percent, a MoM rise of 0.3PP. (50 percent is the breakpoint between contraction and expansion.) The sub-indexes for customer inventories (-6.6PP), imports (+3.5PP), slow deliveries (-3.4PP), and input prices (-3.3PP) exhibited the largest changes.
IHS Markit’s headline PMIs both declined but remained firmly in expansion. “US business activity continued to grow at a solid rate in November, adding to signs the pace of economic growth is accelerating in 4Q after the Delta [variant]-induced slowdown of 3Q,” wrote Markit’s Chris Williamson. “Growth is lopsided, however, being led by the service sector as manufacturing remains heavily constricted by supply shortages and, in some cases, labor supply issues. These constraints are also increasingly affecting service providers, as evidenced by the service sector reporting a near record buildup of uncompleted orders during November as companies often lacked the capacity to meet demand. Cost pressures in the service sector also spiked higher in November, generally linked to higher prices paid for inputs and staff due to shortages, the rate of inflation running just shy of May’s all-time peak.”
The consumer price index (CPI) increased 0.9 percent in October (6.2 percent YoY, the largest 12-month increase since November 1990) after rising 0.4 percent in September. The monthly all-items increase was broad-based, with increases in the indexes for energy, shelter (+0.5 percent), food, used cars and trucks (+2.5 percent), and new vehicles (+1.4 percent) among the larger contributors. The energy index rose 4.8 percent over the month, as the gasoline index increased 6.1 percent and the other major energy component indexes also rose. The food index increased 0.9 percent as the index for food at home rose 1.0 percent.
Concurrently, the producer price index (PPI) increased 0.6 percent (+8.6 percent YoY). Over 60 percent of October’s headline increase can be traced to a 1.2 percent rise in prices for final demand goods, led by a 6.7 percent jump in the gasoline index. The index for final demand services moved up 0.2 percent, primarily because of an 8.9 percent rise in the margins for automobiles and auto parts retailing. Prices for final-demand construction advanced 6.6 percent.


