
3 min read
This is the second installment of a two-part series documenting land use changes and how they have affected forests in the US and US South. These posts were informed by Forest2Market’s report entitled “Historical Perspective on the Relationship between Demand and Forest Productivity in the US South,” which is available here.
Part I of this series covered land use change in the United States, which has been heavily influenced by an expanding population and new housing development. In Part 1, we showed that the amount of developed land nationwide increased by about 42.2 million acres (59 percent) from 1982 to 2012 while forest land increased by about 3 million acres (1 percent). However, only about 91 percent (374.3 million acres) of forest land was stable across this time period; 9 percent, or 36 million acres, converted to other uses.
Part 2 of this series focuses specifically on the US South, where development pressures have had a more pronounced effect.
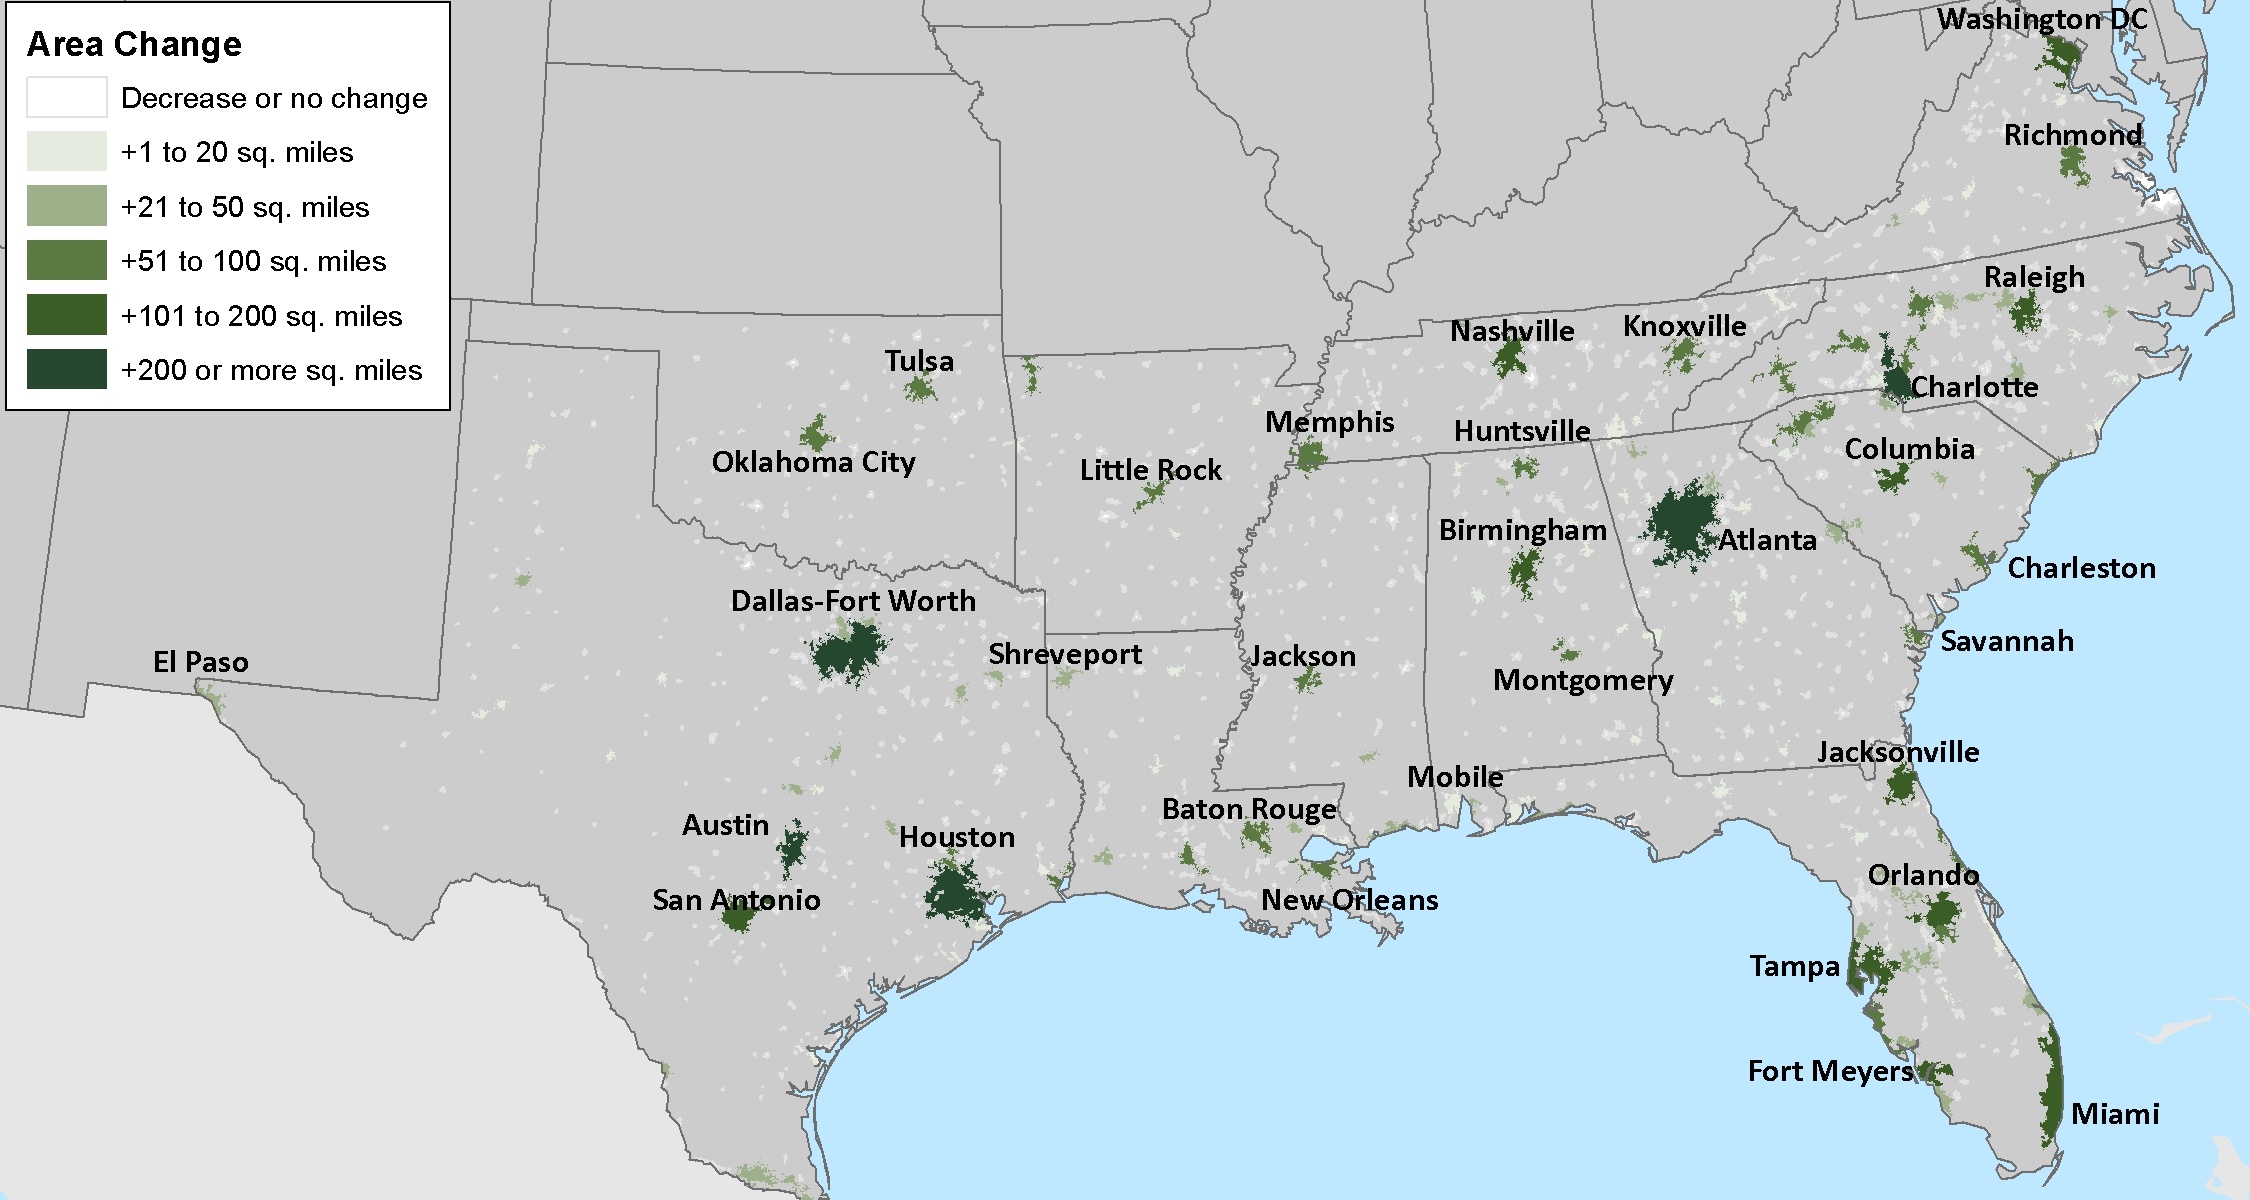
Between 1990 and 2010, the US South experienced higher than average growth in urban area.[i] According to a Forest Service[ii] report, urban area in the United States increased 45 percent, but urban area increased 61 percent in the South during this period. Figure 1 shows changes in urban areas between 2000 and 2010 in the US South. White areas show that urban zones decreased or remained the same size.; green areas indicate that urban zones increased in size. Each state in the South had urban areas that increased in size during this period, but Texas, Georgia, Florida and North Carolina were particularly affected by urban expansion. There was very little decrease in urban area in the South during this period.

Figure 1 Change in Urban Area Size, 2000-2010
In fact, between 1982 and 2012, developed land increased by 19.3 million acres (79.9 percent) from 24.2 to 43.5 million acres in the US South (Figure 2). This means that around 46 percent of the conversion to development that occurred in the US during this period occurred in the South, an area that comprises just 22 percent of US land area.
Over this same period, forest land increased 1.0 percent from 173.8 to 175.6 million acres. Meanwhile, cropland decreased by 27.2 million acres (27 percent), pastureland by 1.3 million acres (2 percent) and rangeland by 3.5 million acres (3 percent). The South experienced more cropland conversion and less pasture and range conversion than the US as a whole. Around 47 percent of the cropland conversion that occurred in the United States occurred in the South.
While the type of detailed land use change matrix showing US land use change that we reported in Part 1 of this analysis was unavailable for the South, it stands to reason that similar patterns occurred in the South with perhaps more significant conversion from cropland to other uses. While the South—like the United States—gained about 1 percent more forest land over this period, the increase is likely a result of gains in forest land conversion from cropland offsetting losses of forest land to development.
Two Scenarios Demonstrating Forest Land Use
Land use change and urbanization in particular are potentially powerful influencers on forests. Between 2000 and 2010, the Atlanta, Georgia urban area increased by over 680 square miles, the most of any urban area in the United States during this period (Figure 1). Increasing population and urbanization in the Atlanta area has put pressure on nearby forests. Figure 3 below shows an area approximately 33 miles southeast of Atlanta in Henry County as it changed between 1993 and 2016. What was once a well-stocked timberland plantation (with some hardwoods) in 1993 was thinned between 1993 and 1999. By 1999, the first portions of a housing development were started. By 2005, the rest of the development had been created on the previously-thinned timberland, and the area looked much as it did in 2016.
Figure 3 Google Earth Images of Henry County, Georgia, USA, 1993-2016
In contrast, Figure 4 shows a portion of Fairfield County approximately 33 miles northwest of Columbia, South Carolina as it evolved between 1994 and 2016. (The area was primarily pine plantation during this period.) Diverging from Atlanta’s urban area expansion of 680 square miles, the Columbia, South Carolina area gained only 111 square miles of urban area between 2000 and 2010. An area that had been clearcut by 1994 had been replanted and thinned by 2005. By 2015, the previously clearcut area was well-stocked with growing sawtimber.
Figure 4 Google Earth Images of Fairfield County, South Carolina, USA, 1994-2015
While it is impossible to know the specific motivations of the landowners involved in these two scenarios, they do provide important examples of what can happen to timberlands. The first case—Henry County, Georgia—demonstrates what can happen when timberlands are subjected to significant urbanization pressures: They may be converted to development. The second case—Fairfield County, South Carolina—shows how productive timberlands facing less urbanization pressure can be continuously managed, harvested, regenerated and maintained as forest land. Landowners who have access to healthy markets for their timber and less pressure to sell their land to developers help keep forests forested—the conclusion reached in our recent report on demand and productivity in the US South
[i] Urban areas are areas that meet minimum thresholds in population and population density and have a more densely-settled core. See https://www.census.gov/geo/reference/ua/urban-rural-2010.html.


