
 Suz-Anne Kinney
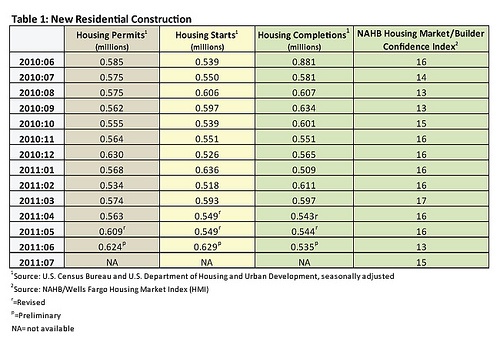
While home sales declined slightly in June, residential construction improved. June starts increased 14.6 percent to 629,000, a year over year jump of 16.7 percent (Table 1). Permits were at the seasonally adjusted annual rate of 624,000, 2.5 percent above May’s revised level and 6.7 percent above the 2010 rate. Builder confidence was up by 2 points to 15.
After a strong month in May (an increase of 8.8 percent), the National Association of Realtors (NAR) Pending Home Sales Index (PHSI) for the month of June was a second bright spot in the market (Table 2). It improved by 2.4 percent from May; the index is also up nearly 20 percent over June 2010’s 75.9 reading, the low point following the expiration of the home buyer tax credit. This was the second month in a row the PHSI was above year ago levels. Despite a higher level of contract signings (pending home sales), existing home sales were down slightly in June to 4.77 million units on an annualized basis (Table 2). This is a drop of 0.8 percent from May. Yun attributed this reversal to an increase in contract cancellations. Most cancellations at this point are due either loans that fell through or appraisals that are artificially low because of a high number of comparable sales from foreclosures and short sales.
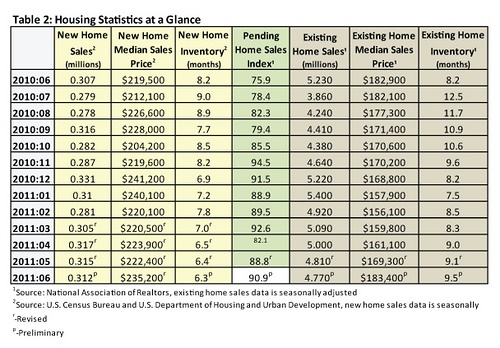
The median price of existing homes in June increased 0.8 percent, to $184,300. Months of inventory worsened, up 4.4 percent from 9.1 months to 9.5 months.
New home sales for June came in at 312,000 units, a 1.6 percent decline from the June 2010 estimate, and a 1 percent decrease from May. Inventory stands at 6.3 months (Table 2). The median sales price for new homes also increased, up 5.8 percent to $235,200.
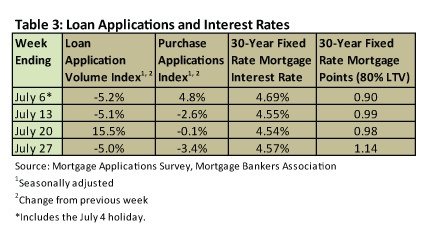
Mortgage rates continue to be incredibly low (Table 3) with interest rates on a 30-year fixed mortgage in June averaging 4.59 percent. Both the Loan Application Volume Index and the Purchase Application Index ended the month about where they began.
Taking a longer term view of the market, a new report by the Mortgage Bankers Association’s (MBA) Research Institute for Housing America (RIHA) tracked homeownership rates from 2000-2009 and analyzed the numbers underlying the long-term trend, the bubble years and the following bust years. According to the report, “Homeownership Boom and Bust 2000 to 2009,” “From the late 1960s to 1997, U.S. homeownership rates fluctuated between roughly 64 and 65 percent. By 2000, however, U.S. homeownership rates had moved up to roughly 67 percent, the highest level recorded to that point in time. That rate jumped to an all-time high of 69.2 percent in the fourth quarter of 2004 and remained at roughly that level through the middle of 2006. With the onset of the 2007 financial crisis, homeownership rates have dropped, falling to 66.4 percent in the first quarter of 2011.”
The report also lays out the circumstances that could determine whether homeownership rates will improve from here or deteriorate. One of the study’s authors, Stuart Rosenthal of Syracuse University, explains: “If underwriting conditions and attitudes about investing in homeownership settle back to year-2000 patterns and, if the socioeconomic and demographic traits of the population look similar to those of 2000, then the homeownership rate may have bottomed out and will not decline further. If, instead, household employment, earnings and other socioeconomic characteristics over the next few years remain similar to those in 2009, then homeownership rates could fall by up to another 1 to 2 percentage points beyond 2011.”


