Since rolling out our groundbreaking SilvaStat360 interactive digital platform in 2017, Forest2Market has continued to develop a series of innovative and analytical solutions for participants in the global forest value chain. The breadth of data available via SilvaStata360 is unparalleled in the industry, and it provides Forest2Market customers with the on-demand data and tools that are most important to them—wherever they operate: North America, Brazil, Scandinavia, the Baltics, Western Russia or Australasia.
As we continue to add new features and functionality to the platform, we are pleased to introduce a series of new and innovative products that are designed to inform and stimulate better decision-making. Included in the new product rollout are PLF visualizations designed to help consumers of logs better understand their position in the market.
Importance of PLF Data
“Pounds per lineal foot” (PLF) is a common forest industry unit of measure, much like “diameter-at-breast-height” (DBH) or “small-end diameter” (SED). However, PLF is a widely accepted industry standard across the US South for ensuring valid comparisons across all logs and loads.
- PLF = (total weight of load) / (total lineal feet of load)
- Weight is measured at the scale
- Total lineal feet is determined by the scaler: Number of logs x Average length of load
PLF data is essential for consumers of logs and pulpwood—especially in competitive and volatile log markets where lines are blurred between traditional product classes. Forest2Market collects PLF data on every load because understanding log size is critical for optimizing wood procurement in the South. While log size is the main driver of price, it is also important to understand what makes up a unique market average when a specific mill buys a very specific log size. Diving into the PLF data via the new SilvatStat360 product – where users can filter by their preferred log size – results in increased market transparency and better comparisons.
PLF Visualization
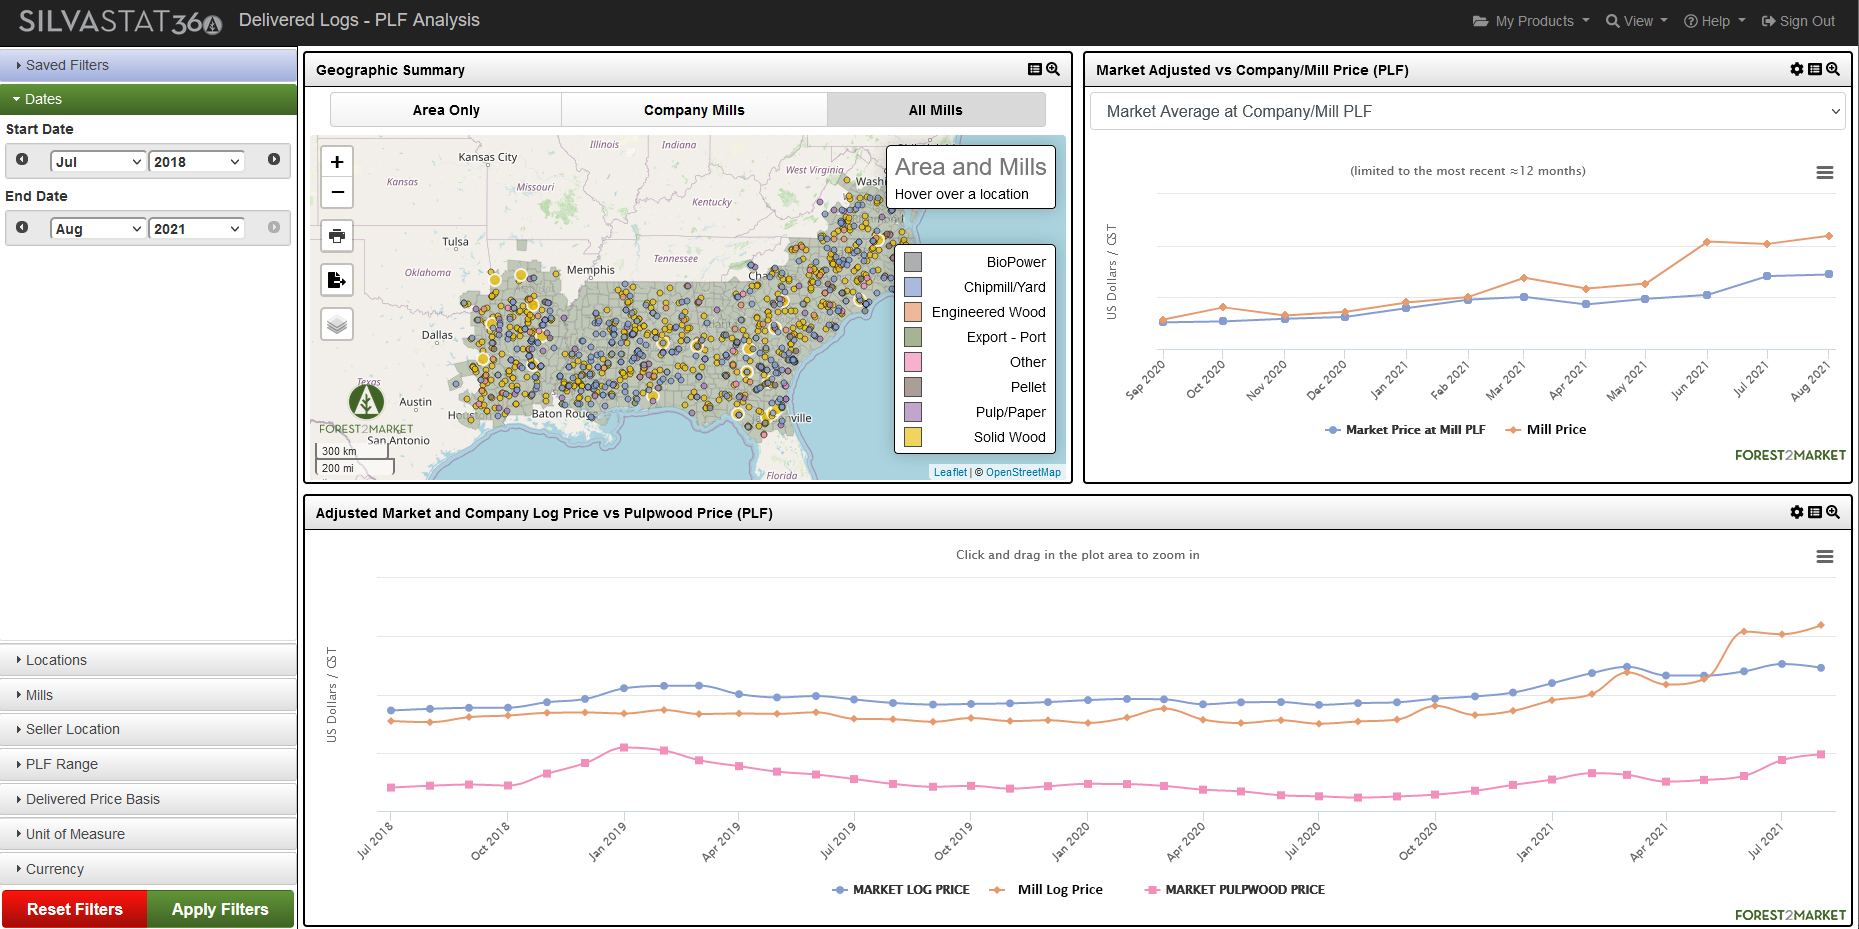
The SilvaStat360 PLF Distribution dashboard provides interactive charts and tables that help users visualize geographies and the data that correspond to their mill facilities, including historical PLF data on product, price and volume. Users can also filter by date, location and mill, as well as filter by PLF range and unit of measure, i.e. green short tons, cubic meters, etc. The data and visualizations can also be downloaded and exported as images to be used in presentation formats.
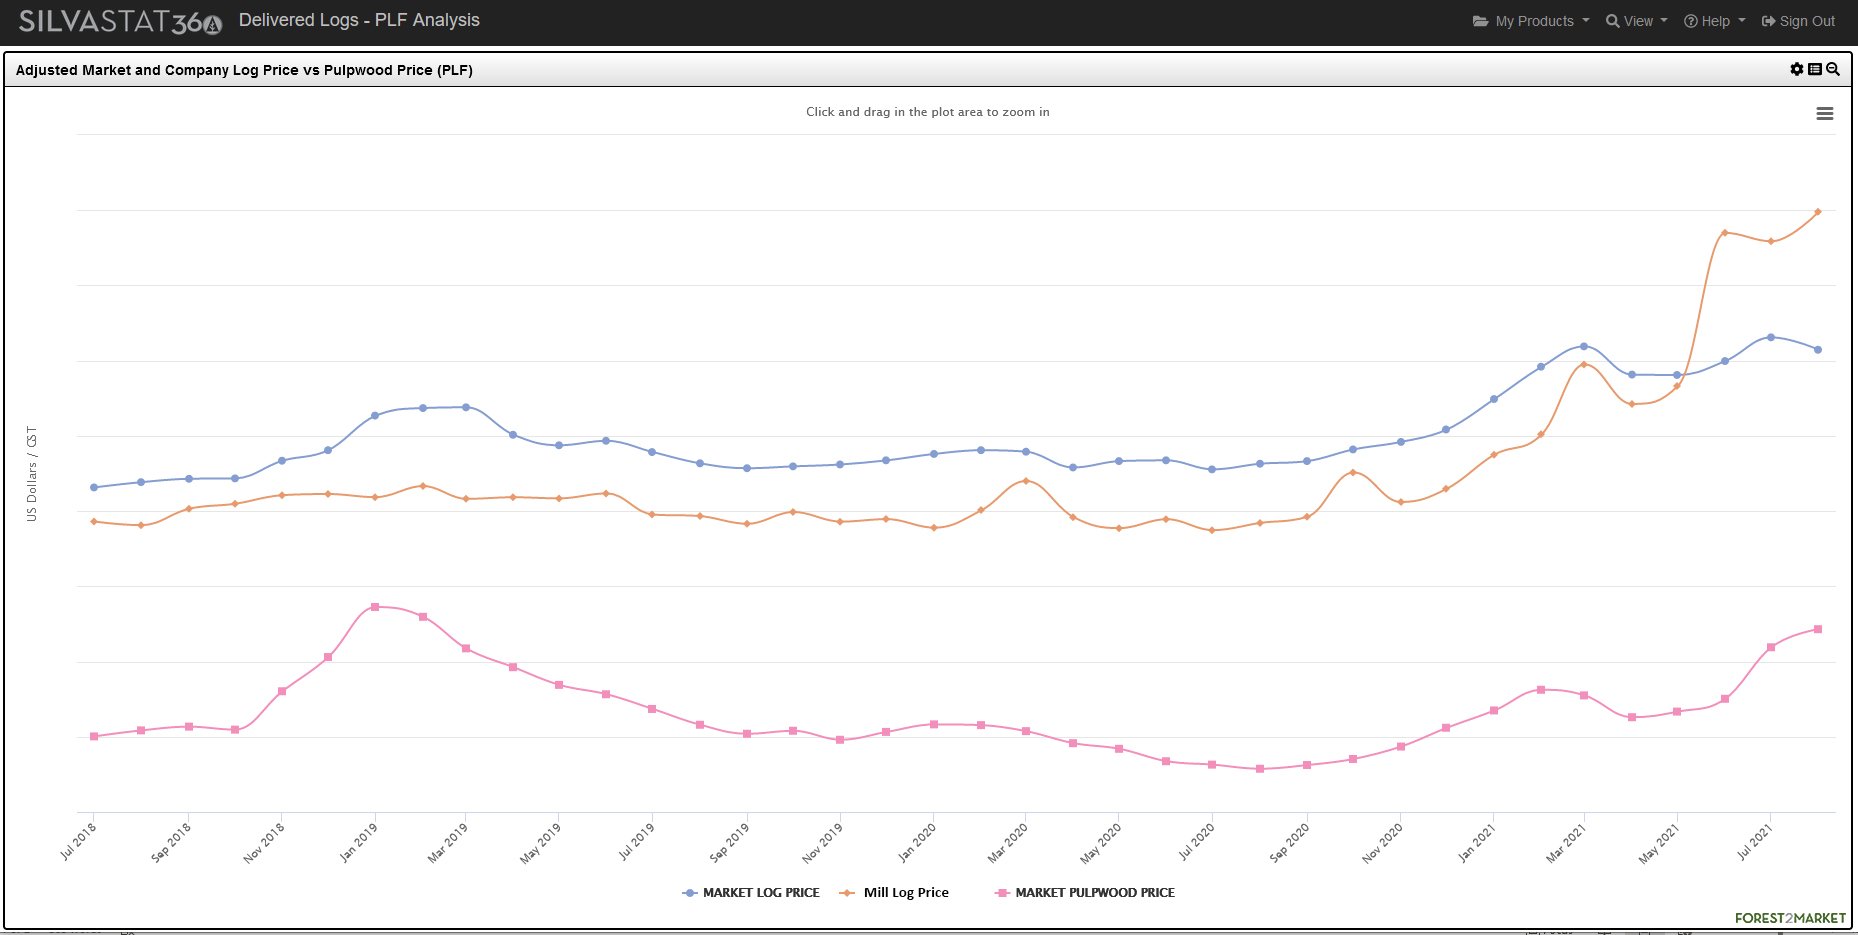
In the dashboard screenshot below, we can see the disbursement of mills by type throughout the US South, a chart illustrating the market adjusted and company mill PLF price, and a chart illustrating adjusted market and company log price vs. pulpwood price in PLF. Sawmills that buy small PLF logs and directly compete with pulp & paper mills (and vice versa) can also see the delta between price for their small CNS log profile and pulpwood in the market.

With the new PLF visualization, subscribers can better compare their company-wide and individual mill log specifications and prices to the market by filtering data to fit their unique mill log profile. This increases transparency and allows customers to better identify areas where they can improve procurement strategies that will drive profitability. Subscribers can use this tool to:
- Identify CNS and pulpwood price deltas
- Track price changes and identify trends in a dynamic market
- Determine specific pricing for preferred raw materials
- Gain efficiency in raw material sales or acquisitions
- Quantify raw material revenues/procurement costs by component
- Measure results against the broader market
- Identify performance improvement opportunities
- Establish facility and individual performance objectives
Southern timber markets are demonstrating much more volatility than they have in recent years. In the south Georgia/north Florida market, for example, competition for pulpwood and CNS has driven prices for these logs to record highs. Forest2Market’s new PLF visualization can provide industry participants in this wood basket with unparalleled transparency into the market – down to their preferred log size - which will drive better decision-making, better cost management, and improved performance.