
US forest industry performance in September and October was recently reported by both the US government and the Institute for Supply Management.
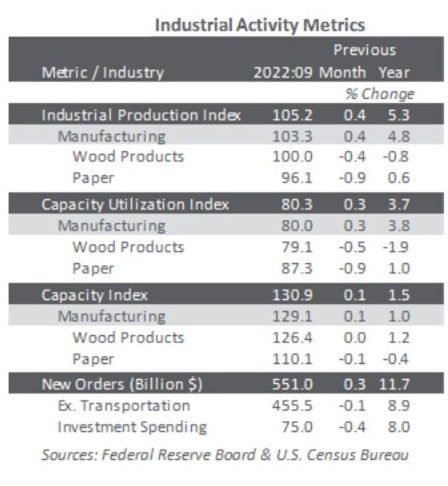
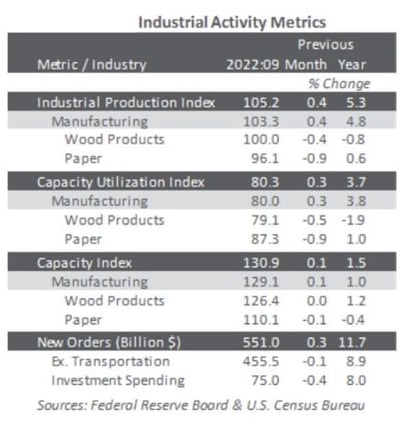
Total industrial production (IP) increased 0.4% in September (+5.3% YoY), and at a +2.9% annual rate during 3Q. Manufacturing output rose 0.4% after advancing a similar amount in August (revised from +0.1%). The index for mining moved up 0.6%, and the index for utilities fell 0.3%. The indexes for durable and nondurable manufacturing rose 0.5% and 0.3%, respectively. Within durables, gains of at least 1% were recorded by nonmetallic mineral products, fabricated metal products, computer and electronic products, and motor vehicles and parts. Within nondurables, declines in paper and in printing and support were outweighed by gains in food, beverage, and tobacco products; apparel and leather; chemicals; and petroleum and coal products.
The Institute for Supply Management’s (ISM) survey of US manufacturers for October 2022 showed momentum virtually stalled. The PMI registered 50.2% (Figure 2), down 0.7PP from September’s reading (50% is the breakpoint between contraction and expansion.) Subindexes with the largest changes include order backlogs (-5.6PP), slow deliveries (-5.6PP), and input prices (-5.1PP). Activity in the services sector decelerated further (-2.3PP to 54.4%). Exports (-17.4PP), new orders (-4.1PP), employment (-3.9PP), and inventories (+3.1PP) exhibited the largest changes.
Changes in S&P Global’s survey headline results were mixed relative to ISM’s: For manufacturing, both surveys barely avoided contraction; for services, ISM expanded more slowly while S&P contracted more quickly.
“October PMI data signaled a subdued start to the final quarter of 2022, as US manufacturers recorded a renewed and solid drop in new orders,” wrote S&P’s Siân Jones. “Domestic and foreign demand weakened due to greater hesitancy among clients as prices rose further and amid dollar strength. As such, efforts to clear backlogs of work, rather than new order inflows, drove the latest upturn in production.”
The consumer price index (CPI) rose 0.4% in September (+8.2% YoY) after +0.1% in August. Increases in the indexes for shelter (+0.7% MoM; +6.6% YoY), food (+0.8% MoM; +11.2% YoY), and medical care (+1.0% MoM; +6.5% YoY) were the largest of many contributors to the all-items rise. These increases were partly offset by a drop in the energy index (-2.1% MoM; +19.8% YoY), led by a 4.9% decline in the gasoline index (+18.2% YoY), despite increases in the natural gas (+2.9% MoM; +33.1% YoY) and electricity (+0.4% MoM; +15.5% YoY) indexes.
Meanwhile, the producer price index (PPI) increased 0.4% (+8.5% YoY), turning around a 0.2% decline in August and -0.4% in July. Two-thirds of the MoM increase in the index for final demand can be traced to a 0.4% rise in prices for final demand services, led by a 6.4% advance in prices for traveler accommodation services. The index for final demand goods also advanced 0.4%, led by a 15.7% jump in the index for fresh and dry vegetables.
Price index performance in the forest products sector specifically included:
- Pulp, paper & allied products: - 0.2% (+13.0% YoY)
- Lumber & wood products: -2.1% (+10.2% YoY)
- Softwood lumber: -4.6% (+14.5% YoY)
- Wood fiber: -0.3% (+4.5% YoY)


