
US forest industry performance in October and November 2022 was recently reported by both the US government and the Institute for Supply Management.
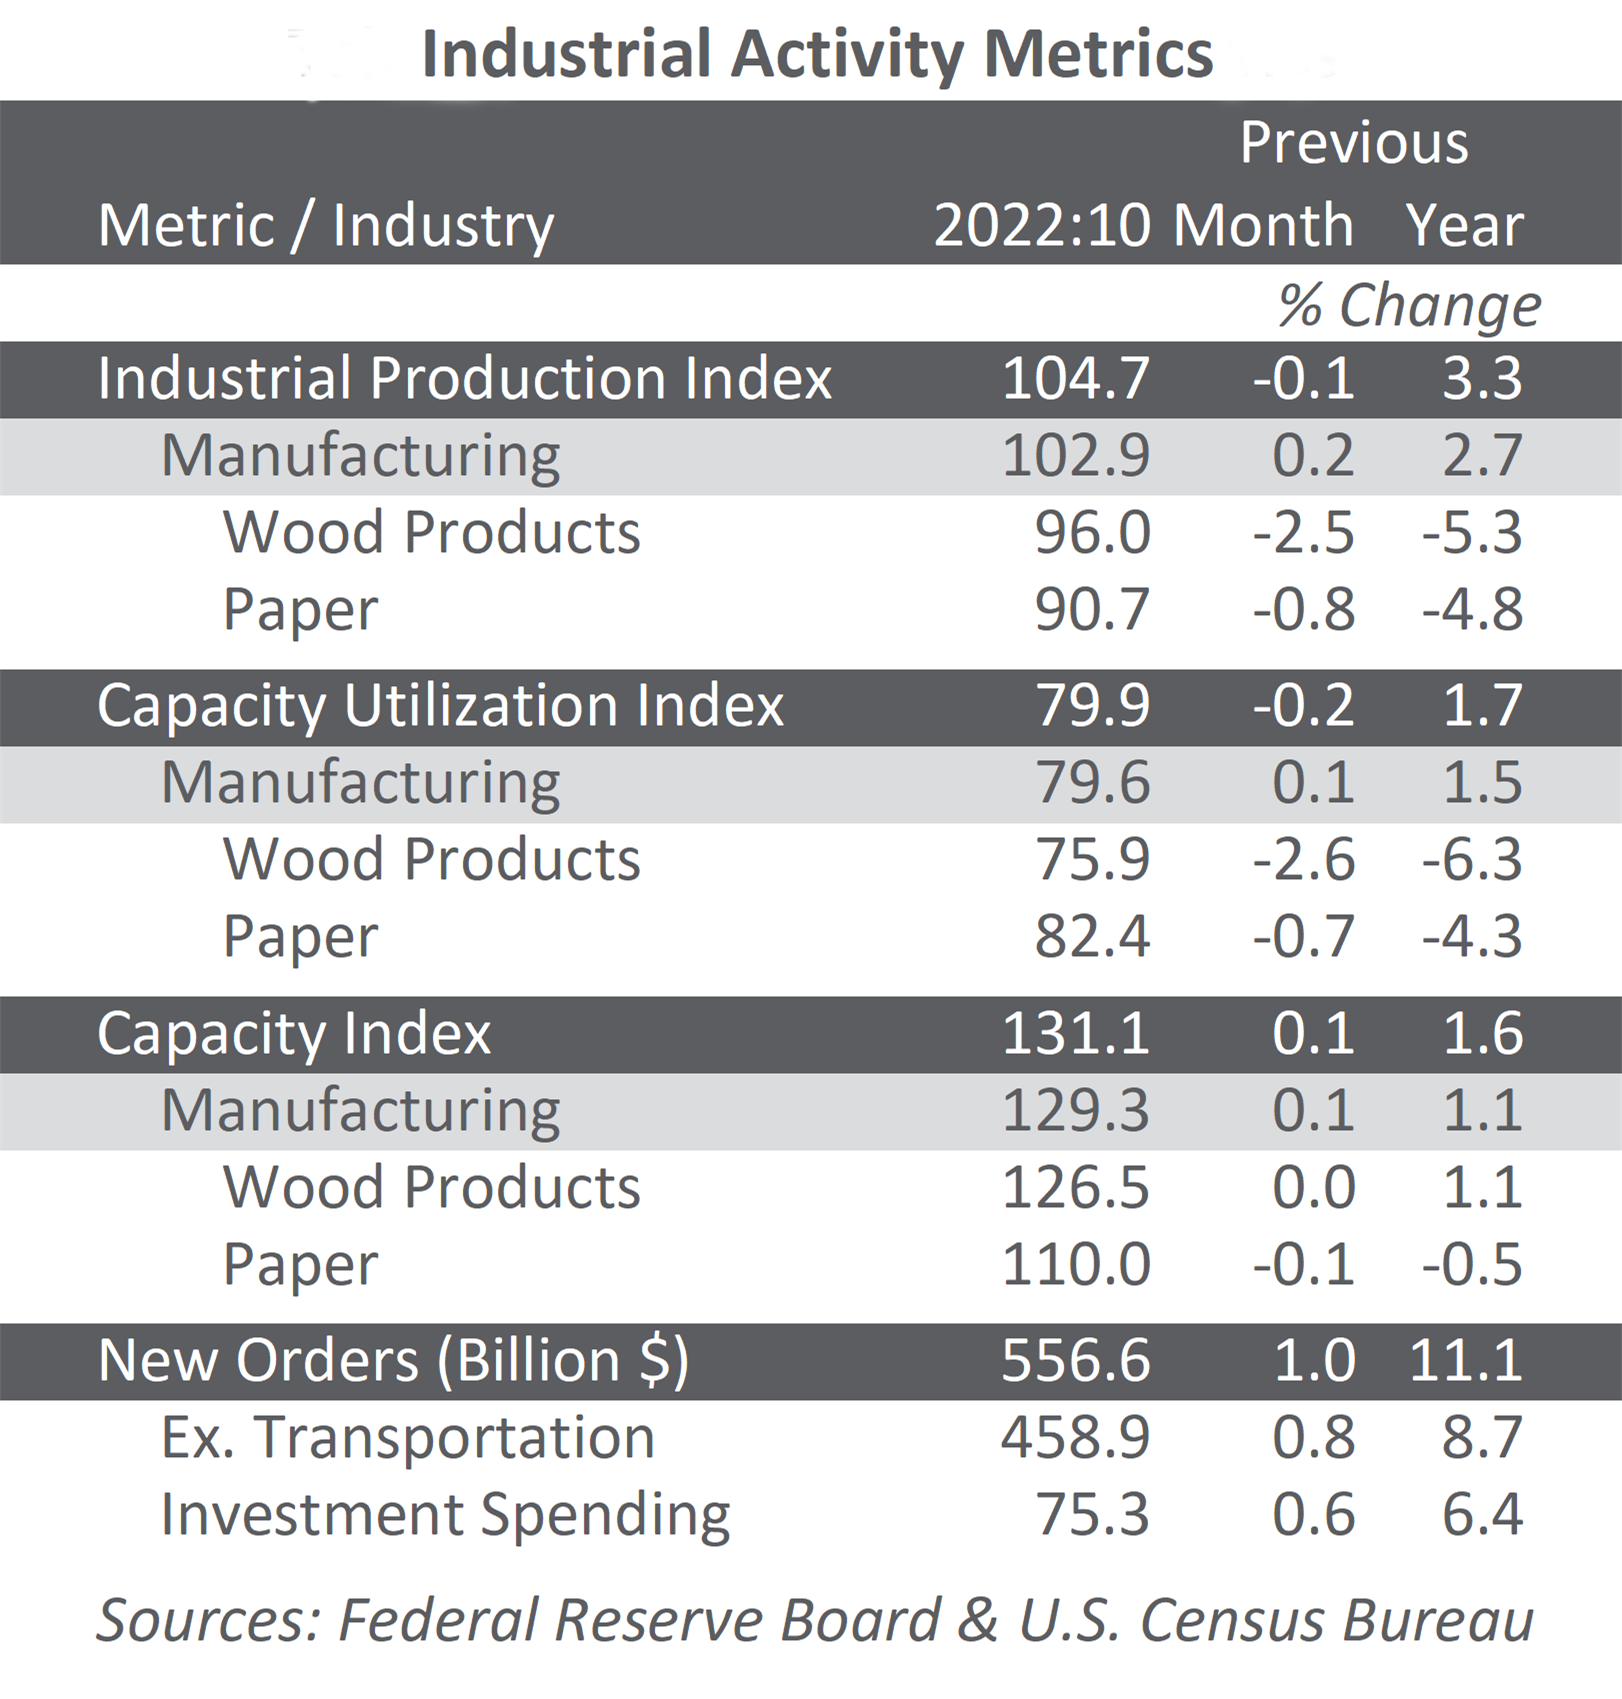
Total industrial production (IP) only dropped slightly by 0.1% in October. Despite this drop, the year-over-year reflects a +3.3% increase from 2021.
September's gain was trimmed to +0.1% (originally at +0.4%). Manufacturing output edged up 0.1% in October, and its increases in July, August, and September were all lower than previously reported. In October, the index for mining stepped down 0.4%, and the index for utilities fell 1.5%.
Concurrently, new factory orders jumped 1.0%, above the expected +0.7% increase. Excluding transportation, new orders were up by 0.8%.
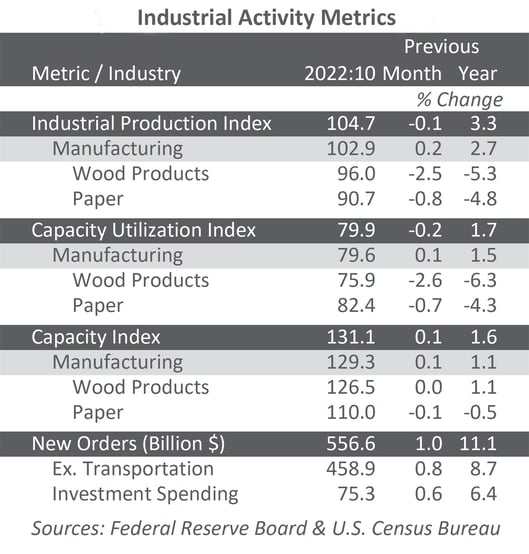
Business investment spending rose by 0.6%, and this boost could help the 4Q GDP by at least partially offsetting the drag exerted by October's widening trade deficit. Since October is only the first month of the fourth quarter, however, the outlook remains uncertain.
Contraction Indicated in ISM Survey
The Institute for Supply Management’s (ISM) monthly sentiment survey of US manufacturers for November 2022 slipped into contraction. The PMI registered 49.0%, down 1.2PP from October’s reading (50% is the breaking point between contraction and expansion).
Subindexes with the largest changes included the following:
- Customer Inventories (+7.1PP)
- Order Backlogs (-5.3PP)
- Imports (-4.2PP)
- Input Prices (-3.6PP)
By contrast, activity in the services sector accelerated in November (+2.1PP to 56.5%). Exports (-9.3PP), imports (+9.1PP), and slow supplier deliveries (-2.4PP) exhibited the largest changes.
Mixed Results for S&P Global’s Survey
Changes in S&P Global’s survey headline results were mixed relative to those of ISM.
For manufacturing, both surveys fell into contraction. For services, ISM expanded more rapidly while S&P contracted more quickly.
Why the disparity between the ISM and S&P Global? As we have explained in the past, the occasional divergence between the two services surveys can be explained by differences in sector coverage. ISM includes the public sector whereas S&P Global does not.
According to S&P’s Chris Williamson, current economic conditions are contributing to the slowing demand. As he noted, “A combination of the rising cost of living, higher interest rates and growing recession fears have led to slumping demand for goods in both the [US] market and abroad. Companies are consequently cutting production at a rate not seen since the global financial crisis, if the initial pandemic lockdowns are excluded.”
CPI & PPI Data
The consumer price index (CPI) rose 0.4% in October (+7.7% year-over-year), the same month-over-month increase as in September. The index for shelter (+0.8% MoM; +6.9% YoY) contributed over half of the monthly all-items increase, with the indexes for gasoline and food also advancing.
Meanwhile, the producer price index (PPI) increased 0.2% in October (+8.0% year-over-year) after rising +0.2% in September and remaining unchanged in August. The rise in the final-demand index can be attributed to a 0.6% advance in prices for goods, led by the index for gasoline (+5.7% month-over-month). In contrast, the index for services decreased 0.1%, led by fuels and lubricants retailing ( 7.7% month-over-month).
Specific data relative to the forest products sector was reported as follows:
- Pulp, paper & allied products: -0.4% (+10.2% year-over-year)
- Lumber & wood products: -1.9% (+6.2% year-over-year)
- Softwood lumber: -1.8% (+4.4% year-over-year)
- Wood fiber: -0.4% (+4.1% year-over-year)


