2 min read
SYP Exports to China on Track to Increase by 163% in 2016; Doug Fir on the Decline, Hemlock Flat
 Daniel Stuber
:
August 5, 2016
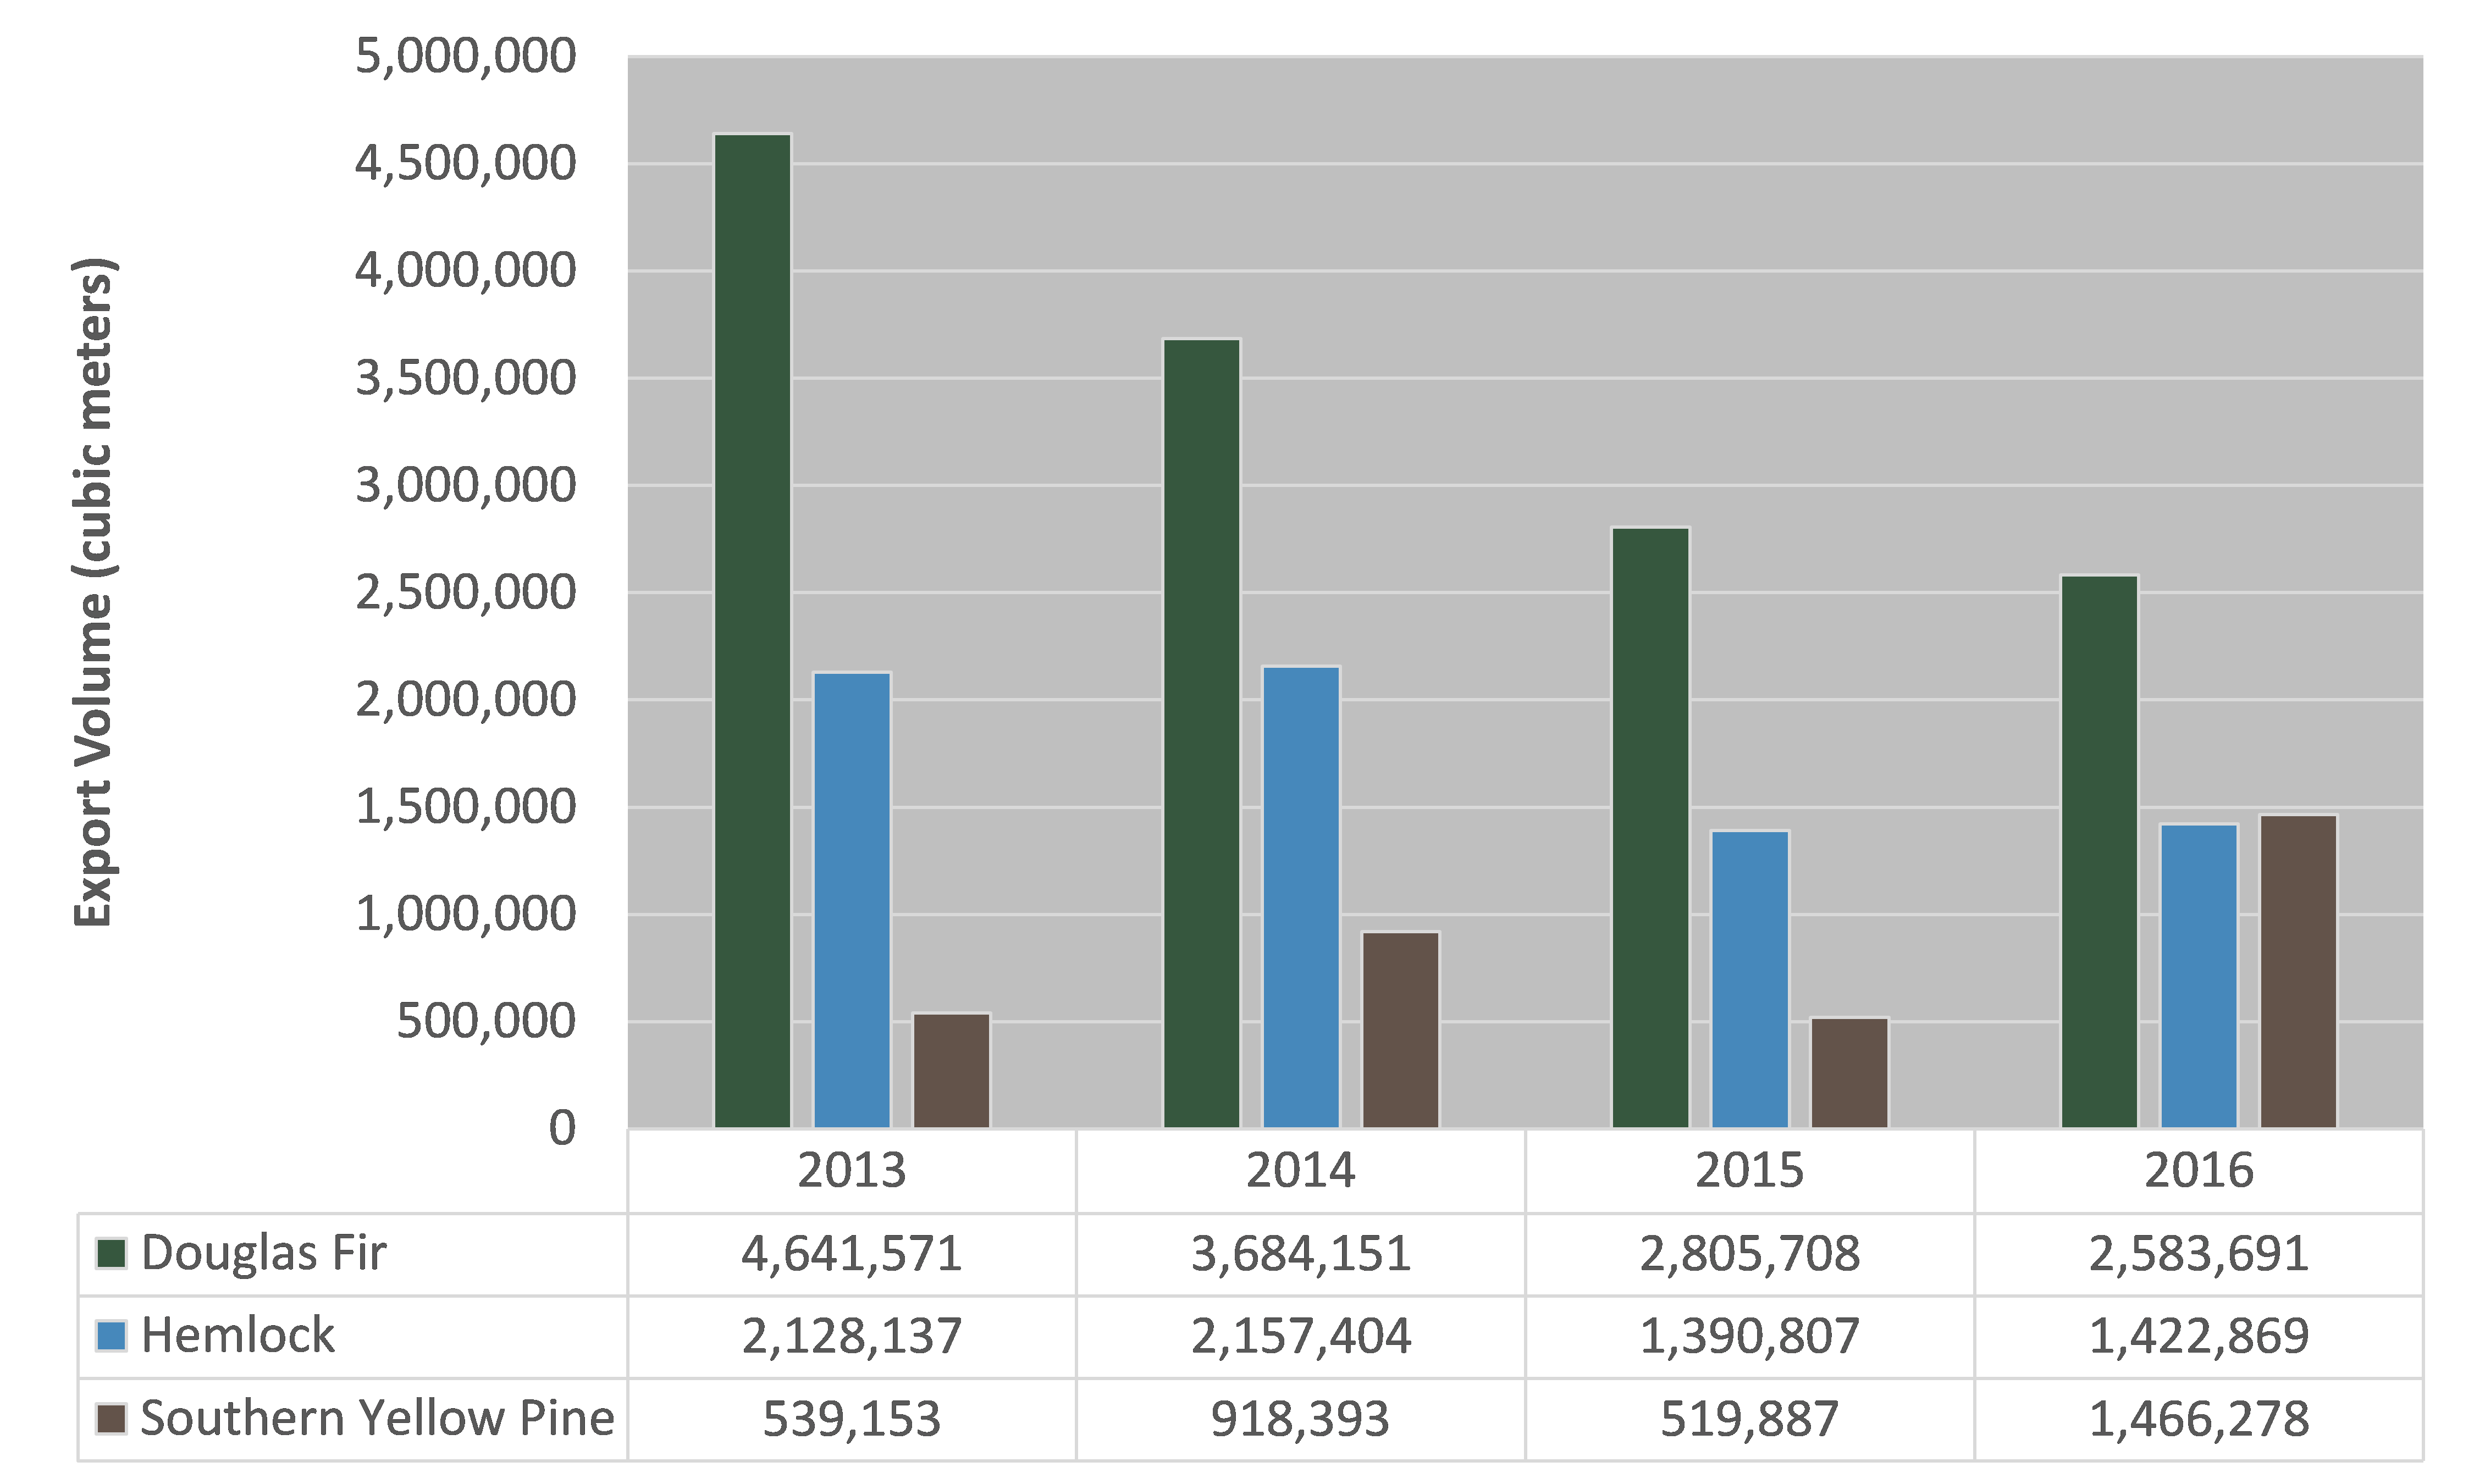
According to trade data compiled by the US Census Bureau through May[1] of 2016, exports of southern yellow pine (SYP) logs to China are on track to increase by a factor of 2.6 times (+163 percent) compared to 2015. At the same time, it looks like China will also be reducing its purchases of Doug Fir by 31 percent; however, Japan is picking up some of this available supply with a 6 percent increase in purchases. As for Hemlock, China has increased its purchases only slightly (+3 percent).
With data available only through May, it may still be too early to tell how final annual numbers for 2016 will shake out, but trend data suggests China (and Japan) will continue to decrease purchases of Doug Fir and increase purchases of SYP logs (Figure 1 and Table 1).
Figure 1 – US Pacific Northwest and US South Log Export Volume, 2013-2016 (Annualized)
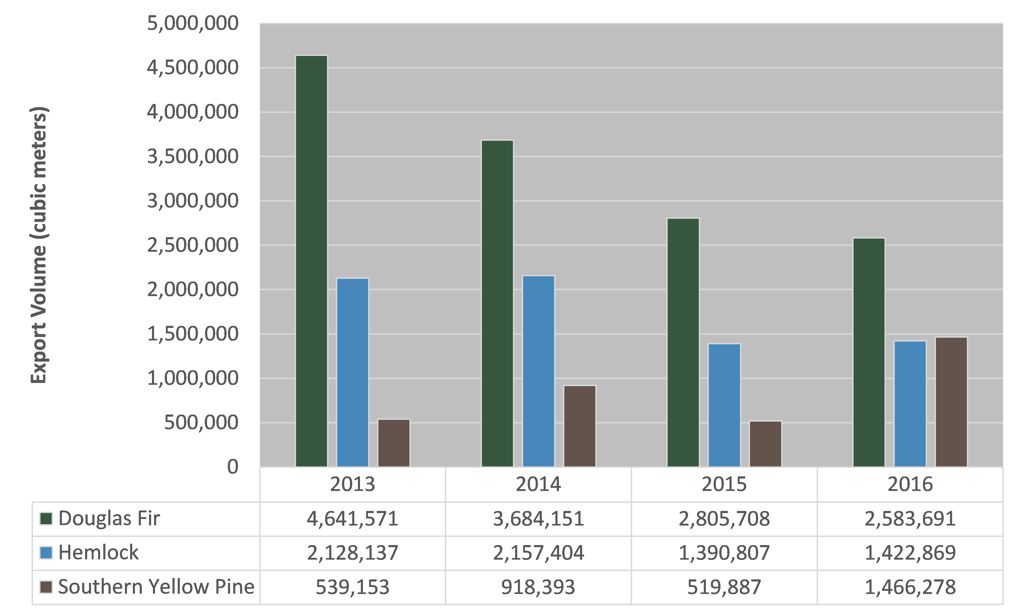
This is likely due to increased export prices[2] for Doug Fir (roughly +2 percent annually since 2013 and +3.3 percent through May 2016 over annual 2015 prices), and decreased prices for SYP (-35 percent through May 2016 over annual 2015 prices) (Figure 2 and Table 1).
Figure 2 - US Pacific Northwest and US South Log Export Prices, 2013-2016 (Annualized)
Table 1 - US Pacific Northwest and US South Log Export Data, 2008-2016 (Annualized)
While the US South export market has historically averaged less than 10 percent of the size of the Pacific Northwest market, its share has grown over the last few years. If the trend through May continues, the US South’s market share will surge to 27 percent, or nearly quadruple its average from 2008 to 2015 (Table 2).
Table 2 - Percent Distribution of US Pacific Northwest and US South Log Export Volume, All Destinations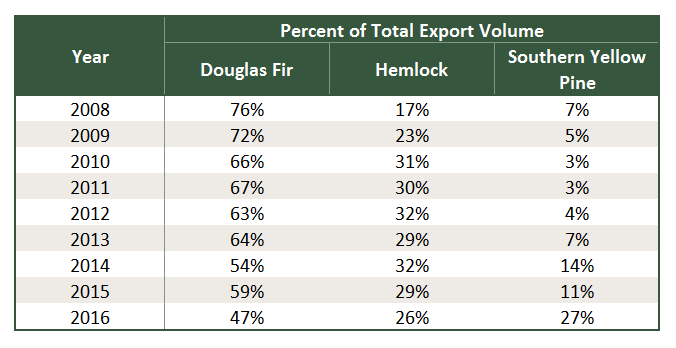
Export volume data by top 3 destinations for each species is listed below. As we stated earlier this year, the strong dollar continues to put US exporters at a trade disadvantage on global markets, but we’ll continue to monitor these trends as 2016 progresses.
Douglas Fir:
Figure 3 - Top 3 Destinations for Douglas Fir Log Exports, 2013-2016 (Annualized)
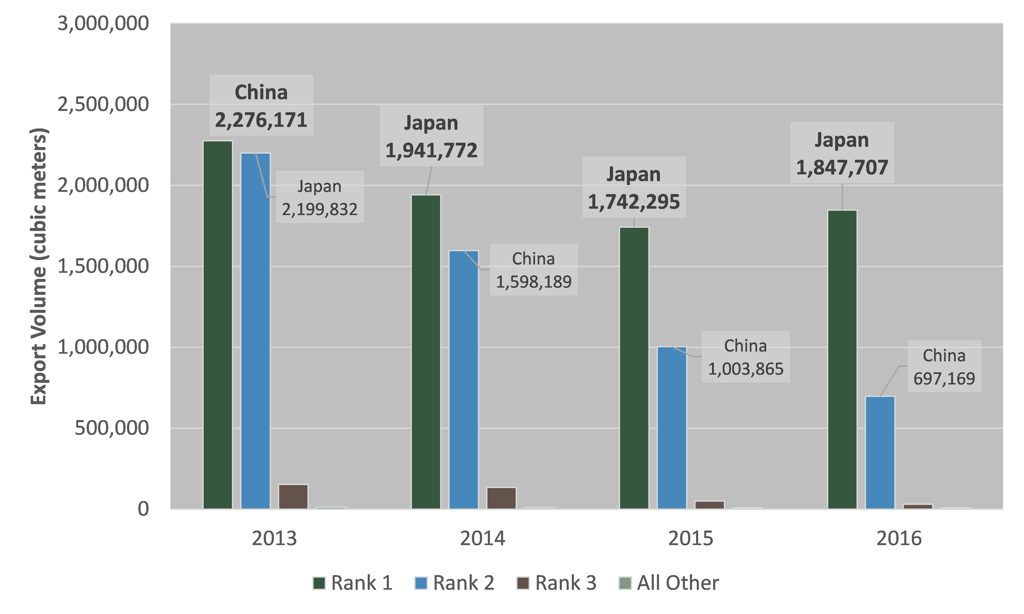
Table 3 - Top 3 Destinations for Douglas Fir Log Exports, 2013-2016 (Annualized)
Hemlock:
Figure 4 - Top 3 Destinations for Hemlock Log Exports, 2013-2016 (Annualized)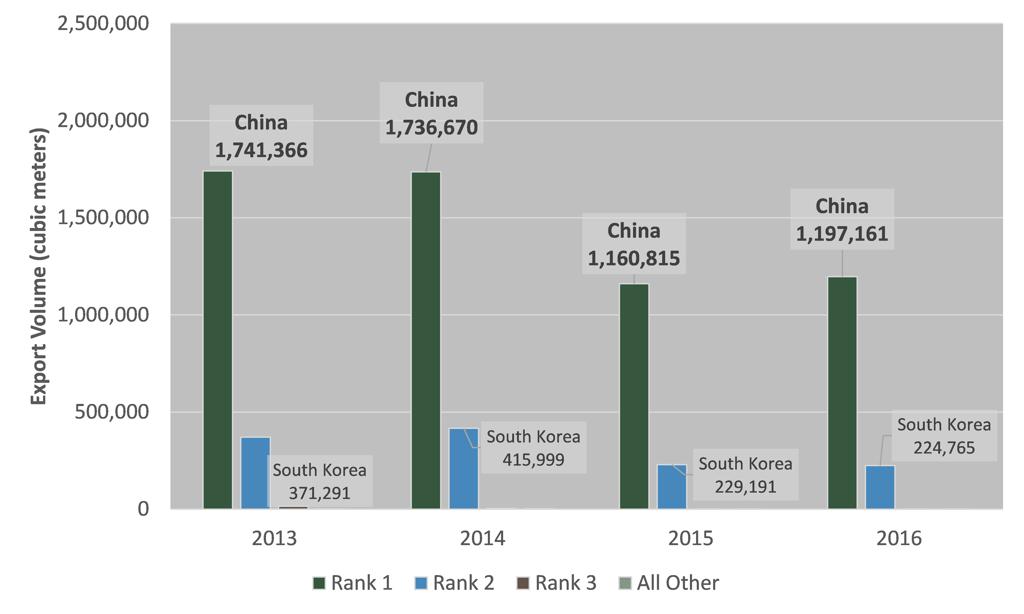
Table 4 - Top 3 Destinations for Hemlock Log Exports, 2013-2016 (Annualized)
Southern Yellow Pine:
Figure 5 - Top 3 Destinations for Southern Yellow Pine Log Exports, 2013-2016 (Annualized)
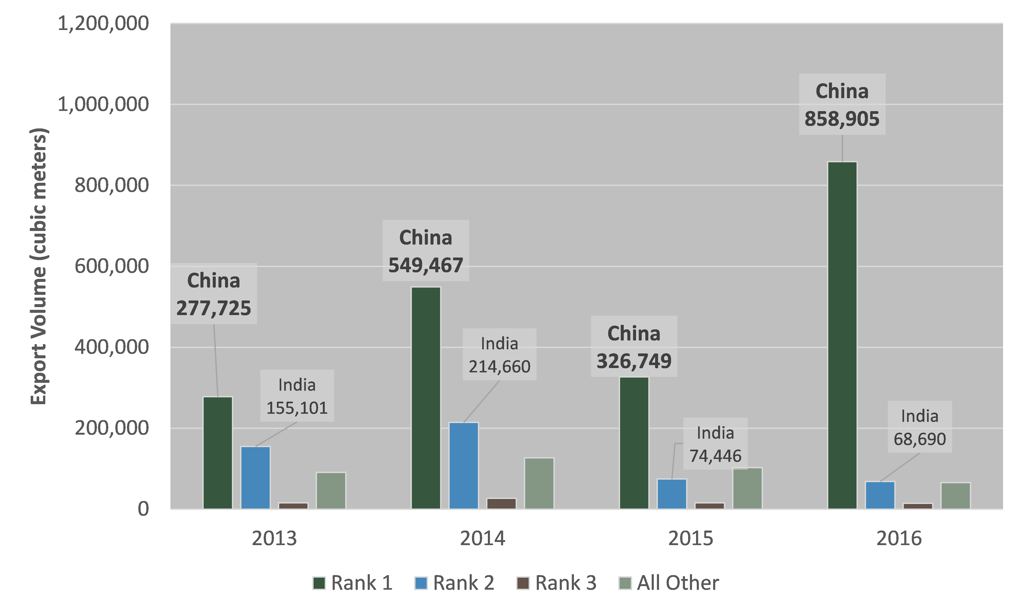
Table 5 - Top 3 Destinations for Southern Yellow Pine Log Exports, 2013-2016 (Annualized)
[1] Based on U.S. Census Bureau district trade data for domestic exports of harmonized commodity codes: 4403200020, 4403200025, 4403200030, 4403200060 and 4403200065
[2] Prices are US dollars per cubic meter and are the Free Alongside Ship value at the port of export. It includes the transaction price, freight, insurance and any other charges in placing the logs alongside the carrier at the port of export. It excludes any cost of loading aboard the carrier, insurance and transportation beyond the port of export.


