
 Joe Clark
US forest industry performance in July and August was recently reported by both the US government and the Institute for Supply Management.
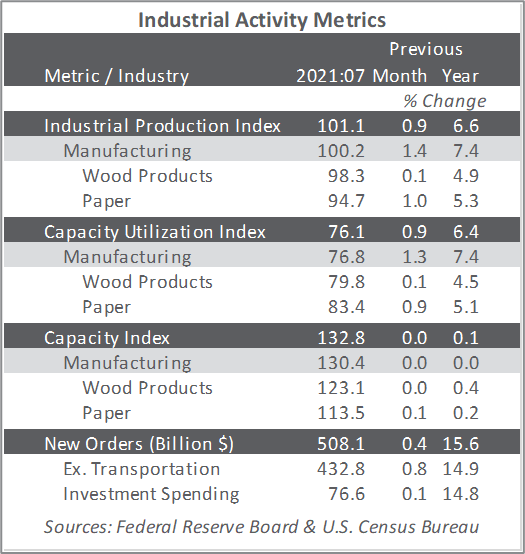
Total industrial production (IP) increased 0.9 percent in July (+6.6 percent year-over-year [YoY], but 0.2 percent below February 2020’s pre-pandemic level). The output of utilities decreased 2.1 percent in July; mining: +1.2 percent.
Manufacturing output rose 1.4 percent (+7.4 percent YoY, and 0.8 percent above its pre-pandemic level). About half of the month-over-month (MoM) gain in factory output is attributable to a jump of 11.2 percent for motor vehicles and parts, as a number of vehicle manufacturers shortened or canceled their typical July shutdowns (this could skew seasonal adjustments). Despite the large increase, a persistent shortage of semiconductors constrained vehicle assemblies such that output was about 3.5 percent below its January 2021 peak.
The Institute for Supply Management’s (ISM) monthly sentiment survey showed a slight increase in the proportion of US manufacturers reporting expansion in August. The PMI registered 59.9 percent, a rise of 0.4PP from the July reading. (50 percent is the breakpoint between contraction and expansion.) The sub-indexes for input prices (-6.3PP) and inventories (supplier: +5.3PP; customer: +5.2PP) exhibited the largest changes.
The services sector retreated from July’s all-time high of respondents reporting expansion (-2.4PP, to 61.7 percent). The most noteworthy changes in the sub-indexes included business activity (-6.9PP), input prices (-6.9PP), and exports (-5.2PP).
All of the industries we track expanded. “Material and labor shortages continue to hinder productivity,” one Construction respondent observed. “Price increases are ever-present and repetitive. Large, multinational manufacturers have had multiple price increases in the last three months.”
IHS Markit’s August survey headlines were mixed relative to their ISM counterparts. For manufacturing, Markit decelerated versus ISM’s slight rise. For services, Markit tumbled further while ISM also retreated.
“Growth slowed sharply in the US service sector in August, joining the manufacturing sector in reporting a marked cooling in demand and encountering growing problems finding staff and supplies,” wrote Markit’s Chris Williamson. “Jobs growth almost stalled among the surveyed companies in August and supplier lead times are lengthening at a near record rate.
“While the resulting overall pace of economic growth signaled is the weakest seen so far this year, backlogs of uncompleted work are rising at a rate unprecedented in at least 12 years, underscoring how supply and labor shortages are putting the brakes on the recovery. The inevitable upshot is higher prices, with firms’ input costs and selling prices rising at increased rates again in August, continuing the steepest period of price growth yet recorded by the survey by a wide margin.”
The consumer price index (CPI) increased 0.5 percent in July (+5.4 percent YoY) a deceleration from June’s +0.9 percent. Shelter (+0.4 percent), food (+0.7 percent), energy (+1.6 percent), and new vehicles (+1.7 percent) were among the many indexes advancing in July. Some indexes retreated, however, including motor vehicle insurance and airline fares.
The producer price index (PPI) increased 1.0 percent in July (+7.8 percent YoY, the largest advance since 12-month data were first calculated in November 2010). Nearly three-fourths of the MoM increase can be traced to a 1.1 percent advance in prices for final demand services, led by an 11.2 percent jump in the margins for automobiles and automobile parts retailing. The index for final demand goods rose 0.6 percent.
In the forest products sector, price index performance included:
- Pulp, paper & allied products: +2.2 percent (+13.3 percent YoY)
- Lumber & wood products: -7.6 percent (+32.5 percent YoY)
- Softwood lumber: -29.0 percent (+45.0 percent YoY)
- Wood fiber: +2.2 percent (+14.2 percent YoY)


