
 Joe Clark
US forest industry performance in September and October was recently reported by both the US government and the Institute for Supply Management.
In the wake of revisions (July: -0.5 PP, to -0.1 percent; August: +0.2 PP, to -0.7 percent), total industrial production (IP) rose 0.3 percent in September (+1.6 percent YoY); the main driver behind September’s MoM increase was a +1.5 percent jump in utilities that only partially offset August’s 4.9 percent tumble. The Federal Reserve estimates the continued effects of Hurricane Harvey and, to a lesser degree, Irma restrained growth in total output by 0.25 PP in September. For broader perspectives, total IP fell at an annualized rate of 1.5 percent during 3Q; it also remains 1.9 percent below its November 2014 peak.
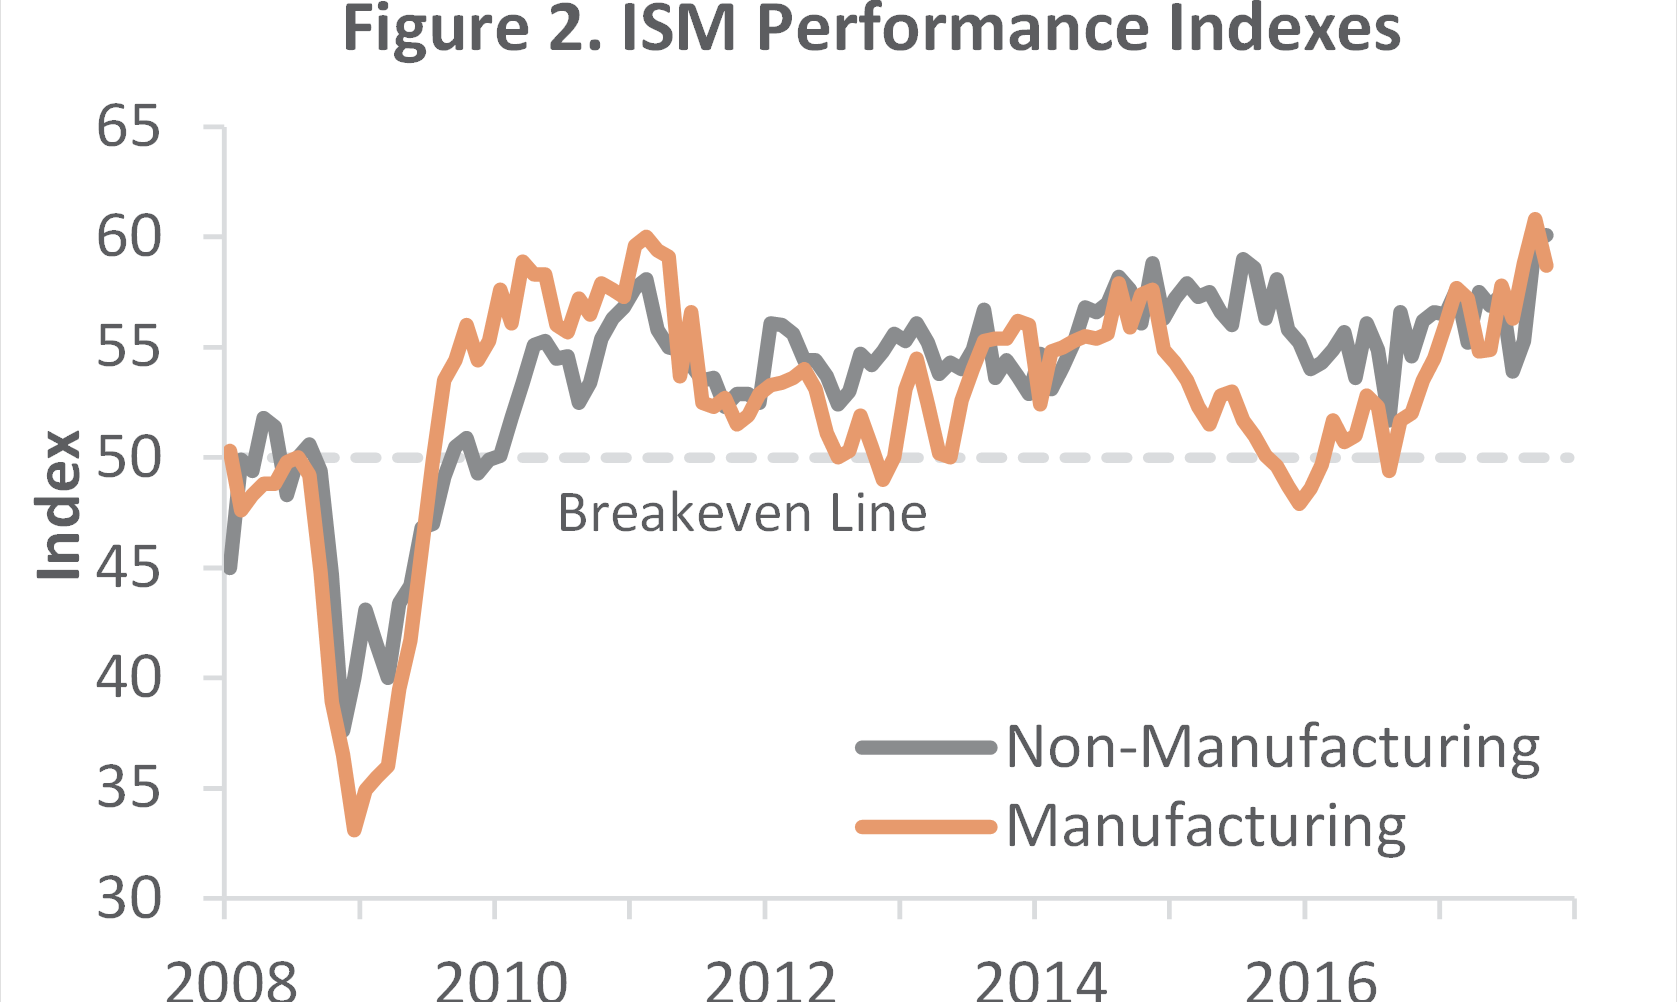
Manufacturing output edged up 0.1 percent in September resulting in a 2.2 percent drop during 3Q, however, manufacturing IP is 4.3 percent below its December 2007 peak. The Institute for Supply Management’s (ISM) monthly sentiment survey suggested that the expansion in US manufacturing decelerated in October. The PMI registered 58.7 percent, down 2.1 PP. Only the customer-inventory sub-index value was higher in October than in September.
The pace of growth in the non-manufacturing sector accelerated (+0.3 PP) to 60.1 percent, the highest NMI reading since that index was created in 2008. All of the sub-indexes values were higher except for new orders, input prices and order backlogs.

The producer price index (PPI) advanced 0.4 percent (+2.6 percent YoY, the largest annual increase since February 2012’s +2.8 percent). The single biggest driver behind the MoM increase was the index for final demand energy (especially gasoline, which jumped 10.9 percent). The Bureau of Labor Statistics (BLS) attributed the higher energy prices to hurricane Harvey’s impact on refining capacity in the Gulf Coast area.
Forest products PPIs were:
- Pulp, Paper & Allied Products: +0.1 percent (+3.7 percent YoY)
- Lumber & Wood Products: 0.0 percent (+3.3 percent YoY)
- Softwood Lumber: -0.9 percent (+11.6 percent YoY)
- Wood Fiber: 0.0 percent (-1.0 percent YoY)

Whereas the ISM and Markit surveys found generally lower input prices, BLS’s data suggest mounting pressure beyond the impacts attributable to energy sector supply-chain disruptions. “While the hurricane-driven energy price increase may fade, there still are some cost pressures building in a variety of sectors of the economy,” wrote economist Joel Naroff. “In particular, [BLS’s] services prices were up in just about every major category except construction.”
We see QoQ changes in the CPI fluctuating between +0.9 percent and +3.5 percent annualized rates, for an overall average of +2.2 percent. The PPI will range between +0.4 percent and +2.9 percent, averaging +2.0 percent overall.


