 Daniel Stuber

Despite some disparate regional data, delivered prices for roundwood followed a general downward trend based on Forest2Market’s 1H2016 data[1]. Favorable weather conditions and low fuel costs during the last four months have freed up supply and nudged prices lower. With the exception of the Northeast/East Canada region, supply has not been an issue on a national basis. The following data compares 1H2016 price averages to the same period last year for our four primary operating regions: US South, Pacific Northwest (PNW), Lake States and Northeast/East Canada. In addition, a comparison for conifer sawtimber between the US South and PNW (West-Side) is provided.
Conifer Pulpwood
Delivered prices for conifer pulpwood decreased in all regions, while supply results were mixed (Figure 1). The Northeast/East Canada market experienced the largest decline, primarily due to mill closures throughout the region. Delivered price dropped $5.09 per ton in 1H2016 compared to the same period last year, and supply decreased a whopping 30.2 percent.
In the Lake States and the Pacific Northwest, delivered prices were almost $3.00/ton less than their averages from a year ago. Supply results were mixed. In the Lake States, prices declined $2.77/ton while supply decreased 9.1 percent. In the PNW, delivered prices dropped $2.96/ton while supply increased 15.1 percent.
In the US South, delivered prices ticked down by $0.23/ton, and supply was up roughly 4 percent.
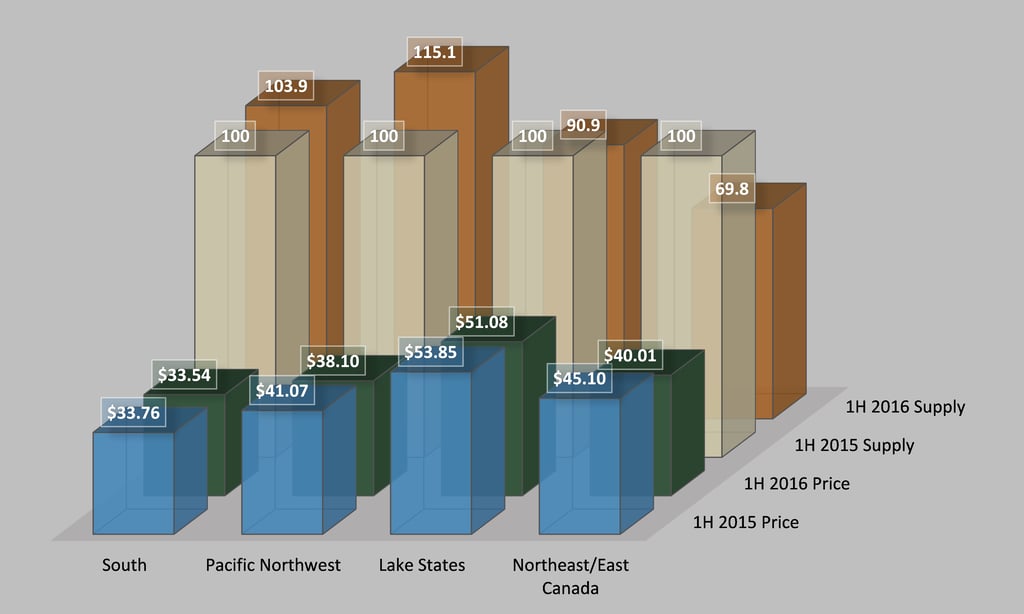
Figure 1: Conifer Pulpwood Delivered Prices and Supply – 1H2016 vs. 1H2016
Hardwood Pulpwood
Hardwood pulpwood market performance generally mirrored conifer performance; delivered prices decreased in all regions while supply results were mixed (Figure 2). The largest price decreases occurred in the Northeast/East Canada and Lake States regions. In the Northeast/East Canada market, delivered prices decreased $5.06/ton while supply was down by roughly 1 percent. However, in the Lake States, delivered prices decreased while supply increased: prices were down $3.94/ton while supply increased by 4.1 percent.
In the Pacific Northwest, hardwood pulpwood delivered prices decreased $0.35/ton and supply increased 18.1 percent.
In the US South, hardwood pulpwood delivered prices decreased $1.68/ton and supply decreased 6.0 percent.
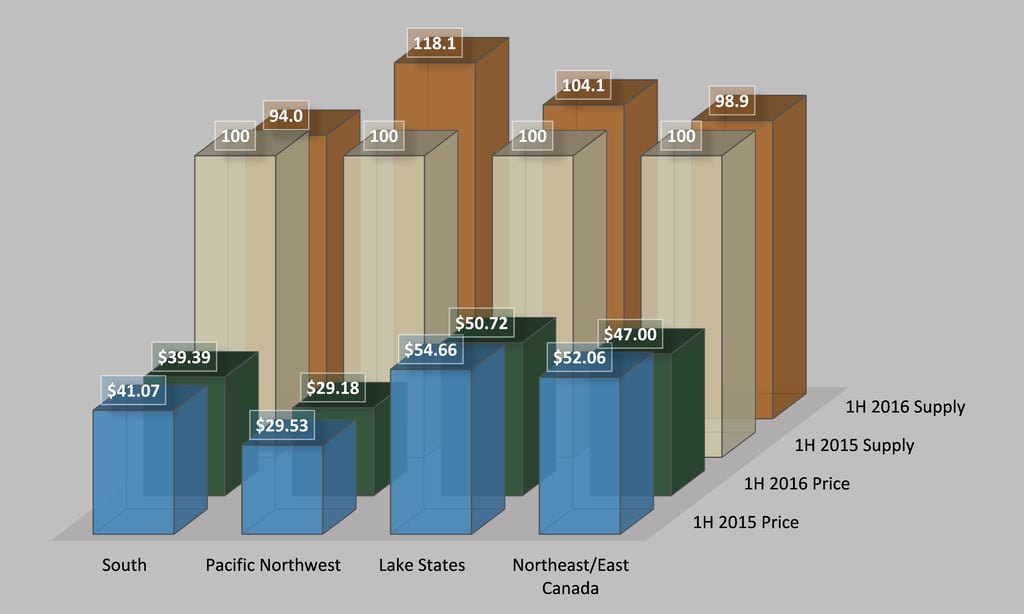
Figure 2: Hardwood Pulpwood Delivered Prices and Supply – 1H2016 vs. 1H2015
Conifer Sawtimber
US South sawtimber markets in 1H2016 declined compared to a year ago (Figure 3). Lumber prices were depressed by roughly $36/thousand board feet (MBF), equating to a 10 percent decrease during 1Q2016 that put further downward pressure on sawtimber prices. Even though lumber prices recovered $47/MBF (13 percent) in 2Q2016, it was not enough to elevate delivered price. 1H2016 sawtimber delivered prices averaged $341.03/MBF ($41.95/ton), decreasing $5.47/MBF ($0.67/ton or 1.6 percent) over 1H2015’s average price. Supply increased by 8.6 percent.
Results in the PNW were mixed, although the gap between domestic prices and export prices contracted. Domestic prices fell $33.90/MBF (-5.4 percent) as delivered supply was unchanged. Export prices were relatively flat but increased $3.95/MBF (0.7 percent) as delivered supply decreased 6.4 percent.
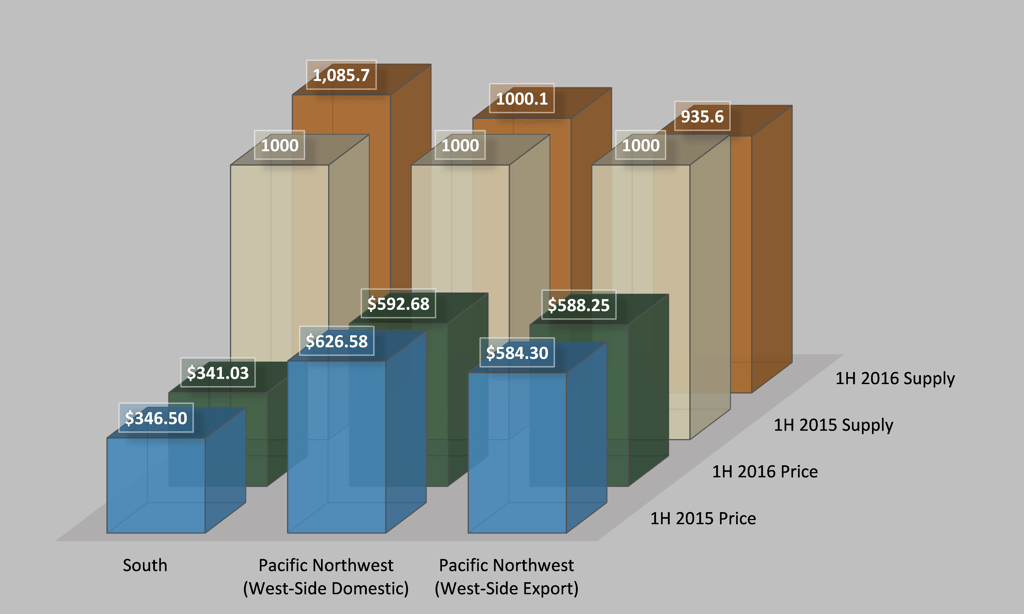
Figure 3: Conifer Sawtimber Delivered Prices and Supply – 1H2016 vs. 1H2015
[1] For pulpwood, quantity supplied is measured by green short tons delivered to consuming mills within each region and indexed as 100 for 1H 2015. For sawtimber, units are thousand board feet indexed to 1,000 for chart scale in comparison to price levels.