Political and corporate landscapes are evolving quickly as environmental, social and governance (ESG) initiatives are transitioning from vagaries just a few years ago into tangible, operational expectations. And the investment community is increasingly applying these non-financial considerations as part of its analysis in identifying material risks and growth opportunities.
Moving forward, corporations will be expected to articulate their ESG strategies as part of a social license to operate. They must do this while also maintaining their reputations with the public and nurturing relationships with consumers in order access capital markets. Those that do it well will participate in a virtuous feedback loop with their communities, customers and shareholders, and those that don’t will destroy value – a breach of their primary fiduciary duty.
We believe carbon is the lightning rod, as it will likely be the key to any environmental scorecard moving forward. This metric already has a number of targets in both governance and markets (Carbon Neutrality by 2050) because impacts on these fronts can be seen and smelled (airborne smog, polluted or unsafe water, etc.) in real time.
With all of these factors converging to shape the future of business, Forest2Market realizes how important it is for stakeholders across the global forest value chain to have access to the reliable and precise carbon-related datasets that impact them the most.
Introducing Carbon Analysis 360
Forest utilization for the manufacture of wood products helps to improve forest health, encourage increased sustainability, and drive carbon sequestration via the lifecycle that is inherent to a working forest. This has historically been a difficult story to relay to a skeptical public, but we can now illustrate the positive impacts of active forest management with precise carbon-related data and visual analytics.
Forest2Market continues to take the lead in developing innovative analytical solutions for participants in the forest value chain – all of which are designed to help inform meaningful decision-making in a rapidly changing global economy. Our Carbon Analysis 360 tool was specifically designed with two important goals in mind:
- To bring a new level of transparency to an increasingly important environmental metric that is redefining global policy, capital markets, and corporate reporting.
- To help participants across the forest value chain better understand the important ways in which they can impact climate concerns, inform decision-making, and identify new opportunities in developing markets.
This data is beneficial for institutional landowners and forest products manufacturers, as well as exporters and importers of US wood raw materials that must meet sustainability criteria and certification schema. Carbon Analysis 360 helps these value chain participants answer the important questions that impact them the most.
Visualizing Sequestered Carbon in Forests
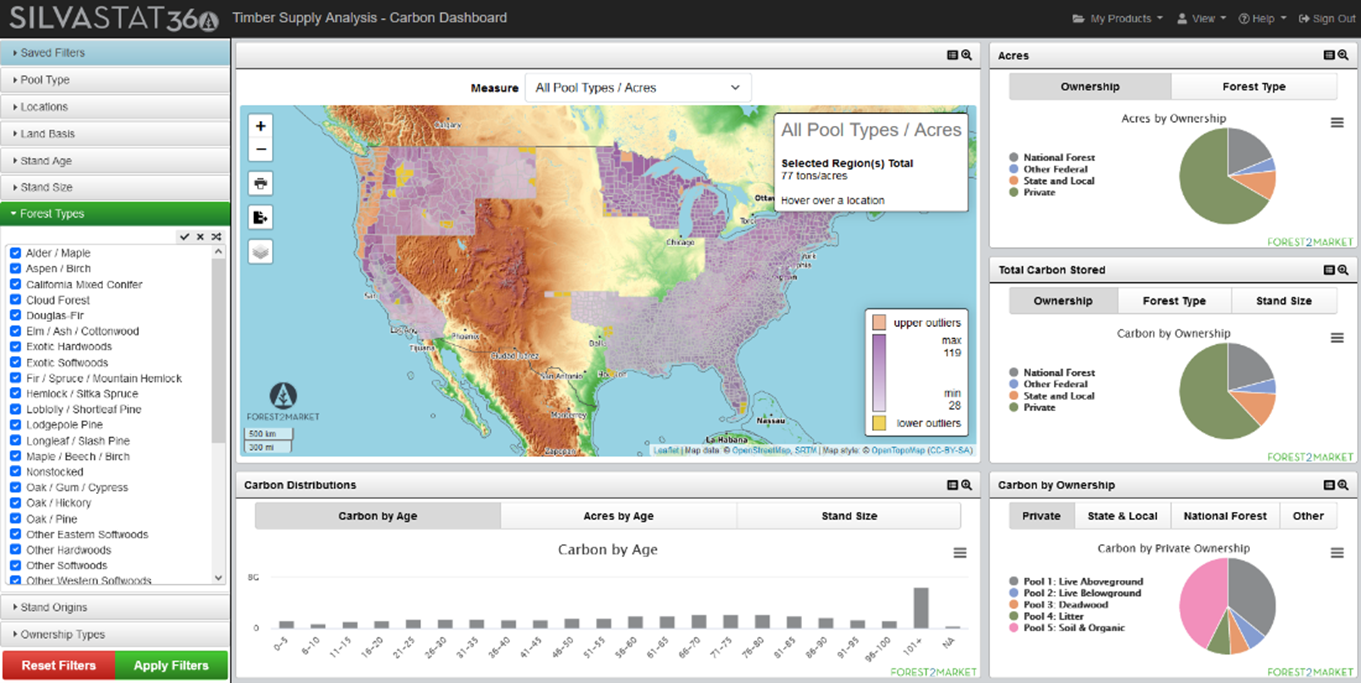
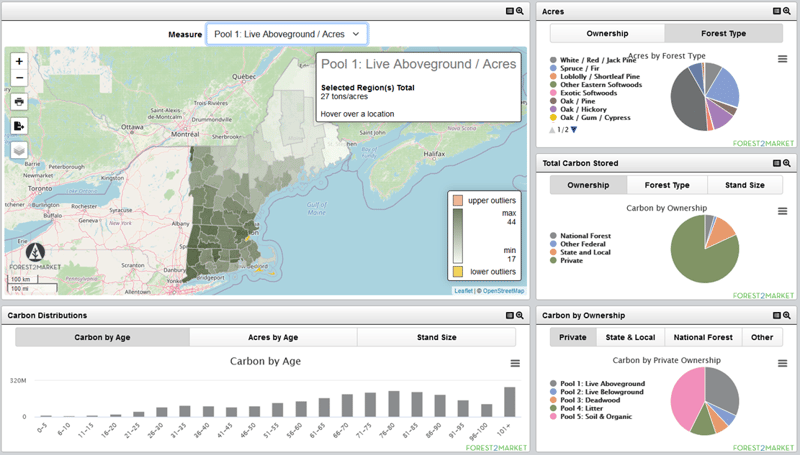
An accurate picture of current carbon stored (expressed in terms of tons of solid (or elemental) carbon in forest resources can be constructed by looking at different procurement zones within individual wood basins. Users can also toggle to view the data in terms of Carbon Dioxide Equivalent (CO2e), a popular metric for ESG reporting.
The Carbon Analysis 360 dashboard provides interactive maps, charts and tables that help users visualize forested US geographies and the carbon data that correspond to them – down to the county level. Users can set the parameters of their initial search by selecting the forest carbon pool types they want to investigate:
- Live Aboveground
- Live Belowground
- Deadwood
- Litter
- Soil & Organic
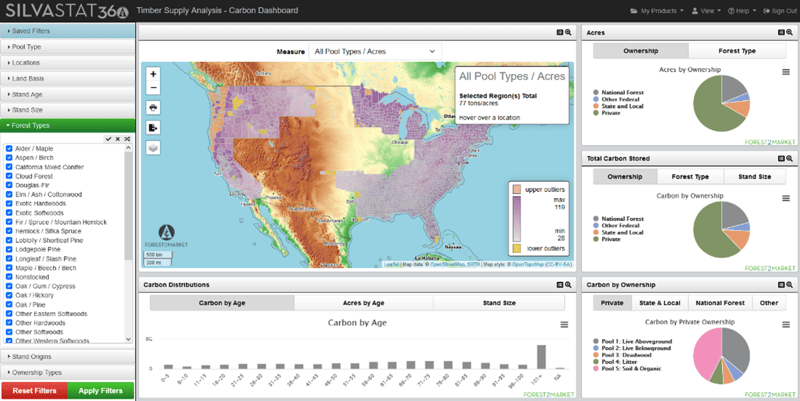
Users can then drill down further by filtering for location and land basis, as well as stand age, size and origin, forest type, and ownership type. All of this data can be further refined and categorized based on pool type and viewed in the aggregate or by tons per acre. Data and visualizations can also be downloaded and exported.
Currently, sustainable forestry practices that result in harvested mature trees that are converted into long-lived wood products are the most effective tool we have to maximize CO2 sequestration. From there, harvested acres can be replanted with new, young trees that will benefit from accelerated growth and carbon storage – continuing the natural lifecycle of the forest. This has been the approach of the forest products industry for decades and, due to its imparted climate benefits, should be standard procedure going forward.
As carbon impacts begin to shape the future of business and policy, Forest2Market is proud to introduce this exciting new tool to participants across the forest value chain and beyond.