
 Pete Stewart
Are my wood costs too high? This is an age old question, often posed rhetorically. I am sure that all of us— from legends like Frederick Weyerhaeuser, the Calders and the Camps (Union Camp) to every procurement manager with boots on the ground—have asked this question.

On the surface, this question seems simple. The answers turn complicated, though, when considering the nuances of the wood supply chain—product and sourcing mix, consumption volume and haul distance to name a few. Throw a little inclement weather into the mix and this mishmash of factors get wrapped around an axle spinning so fast that not even Einstein could theorize his way to an answer. Two of the biggest monkey wrenches gumming up this work are poor data and inappropriate comparisons. They not only lead to the incorrect answers, they lead—more importantly—to answers in which you can have little confidence.
The adage that all wood markets and supply chains are different is true, but more similarities exist among supply chains than we often believe. And, here is the key: these similarities are more informative than the differences. To really understand whether your wood costs are high, you need to start with an apples-to-apples comparison. The first step, then, is finding your peer group, a set of facilities that have characteristics similar to yours. Once you’ve identified the right peer group, isolating cost and supply chain differences becomes meaningful.
How do you identify a peer group? For pulp and paper mills, consumption volume is a defining characteristic. Sawmills will find log measurements more informative.
Wood Fiber Consumption Volume

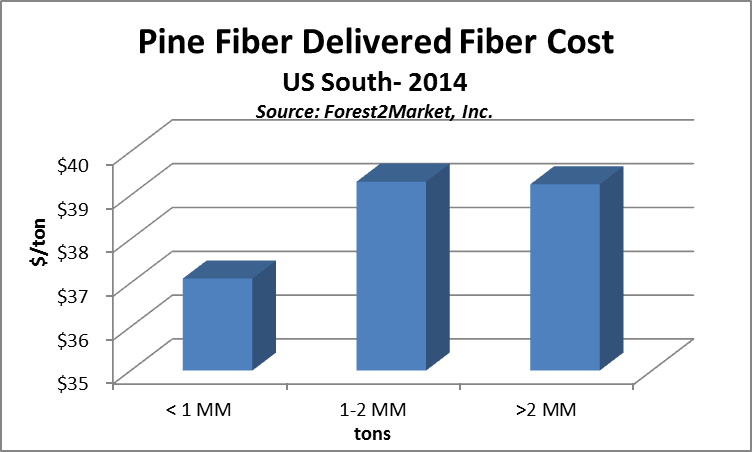
In 2014, pulp mills consuming less than 1 million tons of pine fiber annually paid less for their wood than those consuming more than 2 million tons. The data also showed no difference between facilities consuming between 1-2 million and those consuming over 2 million. Takeaway – know your peer group. In this case, all mills consuming less than 1 million tons are in one peer group and all mills consuming more than 1 million tons are in another.
Log Size
 For sawmills, the most important factor to log pricing is size. In the US South last year, a log size difference of 10 PLF (pounds per linear foot) translated to a $4 per ton cost difference.
Note: 35 PLF = 11.3” DBH; 45 PLF = 13.4” DBH
If a mill with an average PLF of 45 compares itself to mills with an average of 35 PLF, or if it compares itself to the whole market (PLF 40), it will automatically look like a high cost mill, even though—when compared to mills taking the same size logs—its costs are at the market average.
Other Comparisons
While these two examples provide guidance for how data can be used to identify peer groups, a range of other factors should be considered in order to determine whether your fiber costs are too high. These include:
- Haul distance
- Dealer margin
- Volume
- Tree size
- Product mix (chip mill chips v. sawmill chips v. pulpwood)
- Procurement radius
If you can segment these factors into “peer groups” that look like your mill, then you can truly judge wood costs and then make operational and tactical decisions as necessary.


