
After three straight months of consecutively impressive gains, US housing starts dropped in August led by softness in the multi-family segment. With record-low interest rates and surging demand for single-family suburban homes in the suburbs, will this be a temporary dip in the rally or has the housing market hit headwinds?
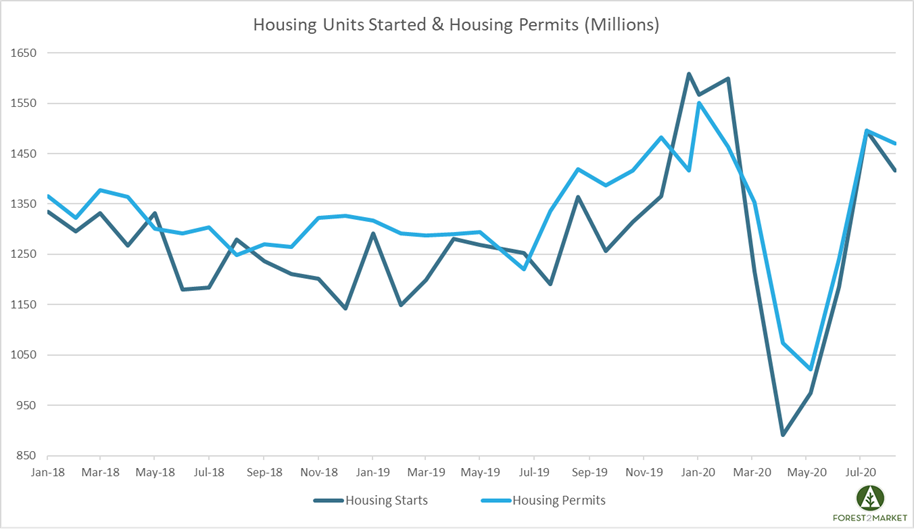
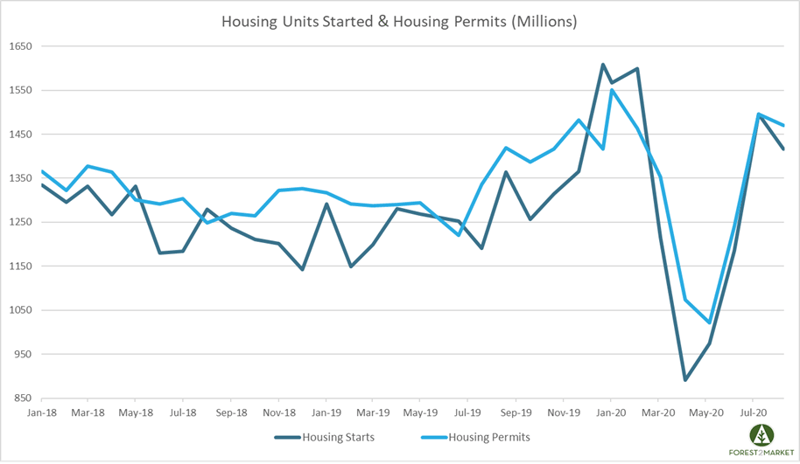
Housing Starts, Permits & Completions
Privately-owned housing starts were down 5.1 percent in August to a seasonally adjusted annual rate (SAAR) of 1.416 million units. Single-family starts increased 4.1 percent to a rate of 1.021 million units; starts for the volatile multi-family housing segment plunged by 22.7 percent to an annual rate of 395,000.
Privately-owned housing authorizations inched down 0.9 percent to a rate of 1.470 million units in August; single-family authorizations were up 6.0 percent to a pace of 1.036 million units. Privately-owned housing completions were down 7.5 percent to a SAAR of 1.233 million units. Per the US Census Bureau Report, seasonally-adjusted total housing stats by region included:
- Northeast: -33.1 percent (+35.3 percent last month)
- South: -17.7 percent (+33.2 percent last month)
- Midwest: +28.4 percent (+5.8 percent last month)
- West: +19.5 percent (+5.8 percent last month)
Seasonally-adjusted single-family housing starts by region included:
- Northeast: -21.9 percent (-2.6 percent last month)
- South: -3.8 percent (+13.3 percent last month)
- Midwest: +20.0 percent (-0.8 percent last month)
- West: +23.4 percent (+6.2 percent last month)
The 30-year fixed mortgage rate dipped in July from 3.02 to 2.94, the lowest level on record. The NAHB/Wells Fargo Housing Market Index (HMI) jumped from 78 to 83 in August, which marks the highest level in the history of the indicator.
Market Trends
Recent data from real estate brokerage Redfin for 434 US metro areas during the 4-week period ending September 13 show just how strong the housing market is right now:
- “Median home sale price increased 13% from 2019 to $319,261—the highest on record. The 13% year-over-year increase was the largest since October 2013.
- Pending home sales climbed 27% year over year.
- The average sale-to-list price ratio, which measures how close homes are selling to their asking prices, rose to 99.3%—an all-time high and 1.1 percentage points higher than a year earlier.
- For the week ending September 13, the seasonally adjusted Redfin Homebuyer Demand Index was up 22.5% from pre-pandemic levels in January and February.”
As we noted in the most recent issue of the Economic Outlook, the recent rebound in housing starts has been driven by strong economic incentives to spur homebuying. “Record low mortgage rates and demand from families looking for more space is fueling the market and is more than offsetting the downward influence of labor market turmoil,” said Maria Fiorini Ramirez economist Joshua Shapiro. “Would-be home buyers are heeding the calls of the suburban and the rural and, at the very least, of bigger abodes,” added BMO Capital Markets’ Michael Gregory.
That seems to be particularly true of New York City. Anecdotally, the number of customers NYC-based FlatRate Moving moved between March 15 and August 15 increased more than 46 percent compared with the same period last year. The number of those moving outside of New York City is up 50 percent—including a nearly 232 percent increase to Dutchess County and 116 percent increase to Ulster County in the Hudson Valley.
Since housing tends to help power the economy over the subsequent year or more, permits and starts from the past couple of months are positive signs for the intermediate term, particularly when paired with July’s recovery in builder sentiment for single-family homes. For perspective on how important gains in residential-related activity have been to the broader economy, housing’s share of GDP reached 16.2 percent during 2Q2020—its highest mark since 3Q2007. The home building and remodeling component (residential fixed investment) held at 3.3 percent of GDP.
Regarding the sharp drop in the multi-family number, it’s worth noting that the Centers for Disease Control and Prevention (CDC) recently issued announcement to suspend rental evictions through year-end 2020 for Americans struggling to pay rent due to the pandemic. That followed an August 8 executive order by President Trump authorizing the suspension as a means of preventing the spread of Covid-19.
The executive order requires renters to prove they have taken “best efforts possible to seek government assistance to make their rental payments;” to “declare that they are unable to pay rent due to Covid financial hardship;” and show they “will likely become homeless or move into congregate housing settings if they are evicted.”
However, the potential for fraud is not trivial. Moreover, this decision merely shifts the problem further up the economic “food chain,” from renters to landlords. Although renters may be covered for now (but will have to pay back rent in January), landlords are (so far) still expected to make mortgage payments and maintain their properties despite the lack of income. Particularly for landlords with one to a few rental units, this moratorium could mean financial ruin—which could set off a chain reaction ultimately impacting banks and holders of collateralized mortgage-backed securities. In addition, even large corporate landlords will need to factor in the risk when deciding whether or not to build—the ultimate result of which could mean fewer new housing units.
Overall, however, “while risks remain to the homebuilding outlook [e.g., soaring lumber prices, which have more than doubled YoY], … with homebuilder confidence reaching a record high in August, the housing sector should remain one of the most resilient areas of the economy,” CIBC Capital Market’s Katherine Judge wrote.


