While US housing starts dropped 3.6 percent in January, new building permits rose to a nearly 13-year high, signaling builders are optimistic about spring activity. However, the escalating sense of panic associated with the coronavirus (COVID-19) outbreak is wreaking havoc on markets around the world, which will eventually show up in the housing-related economic data.
As of this writing, the DJIA is down nearly 3,000 points over the course of just four trading days.
Early estimates regarding the impact of COVID-19 to annual-average global GDP growth have ranged from -0.1PP to -1.0+PP. However, those forecasts assume the outbreak is soon brought to heel, something that appears less likely.
Even if the virus ultimately doesn’t create a full-scale pandemic, it’s easy to imagine how force majeure disruptions to supply chains (e.g., two-thirds of China’s economy was shuttered for an extra week following the Lunar New Year, and residential areas of Beijing have been locked down) might spawn a banking crisis—perhaps first in the export- and China-dependent Eurozone—that ultimately cascades around the world.
Such a crisis would certainly impact the US housing market and, by extension, the North American lumber trade as the globe struggles to deal with the virus and the associated debt-induced fragility.
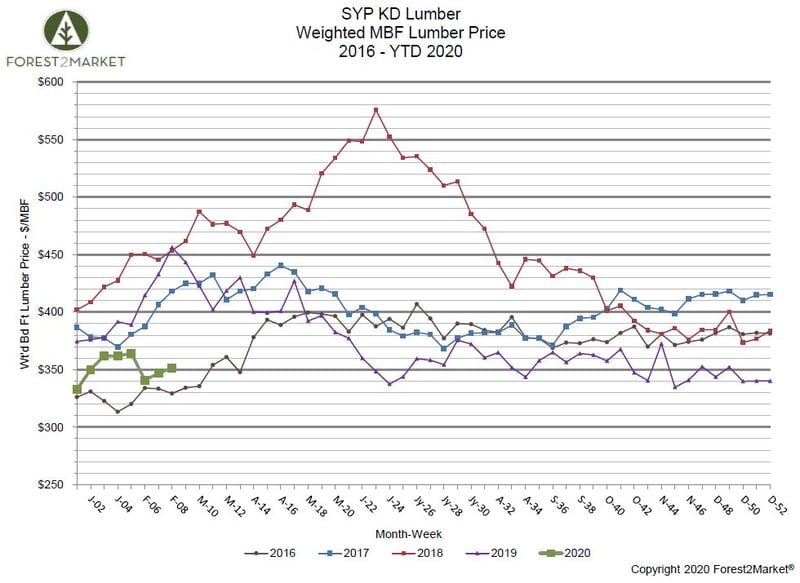
Forest2Market’s composite southern yellow pine (SYP) weekly lumber price average thus far this year is $351/MBF, which is a 12.5% decrease from the same period in 2019.
To provide an analysis aligned with our recent housing market coverage this month, we’ve chosen to look at the most recent two years’ worth of data from Forest2Market’s composite SYP lumber price to help visualize trailing averages and performance. Trailing averages allow us to compare a measurement against a like measurement from a prior term to decipher how much growth (or loss) in value was realized.
Based on that growth, trailing averages provide us with a more representative snapshot of overall performance over time, as well as growth trajectory.
While a simple trailing average chart is not meant to substitute as a comprehensive forecast, the chart can be used to discern general indications of market direction.
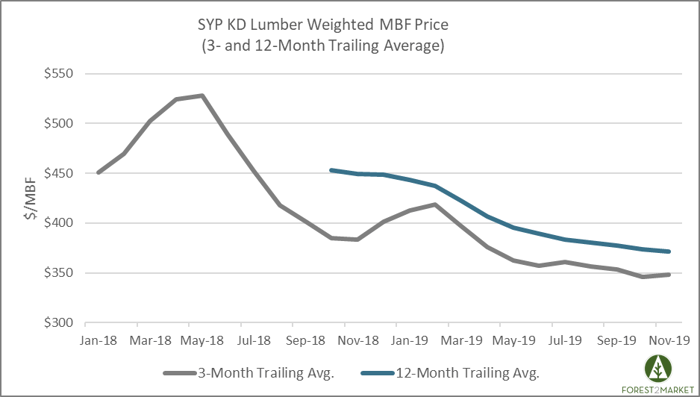
What can we determine from the trailing average data in the chart above?
- The trailing 3-month average naturally demonstrates more volatility than the trailing 12-month average, which covers a longer period of time and smooths out some of the peaks and valleys. In the chart above, the 12-month average demonstrates a noticeable downward trend beginning in December 2018. This makes sense in the context of the data, which is utilizing a “rolling” 12-month average that incorporates the record price spikes that occurred in 2Q2018.
- The trailing 3-month average is a better indicator of short-term performance, as it utilizes data from the previous quarter. Unlike the trailing average chart used in our recent housing analysis, in which the two lines intersect and the 3-month average demonstrates indications of growth, SYP pricing has largely been flat over the last two quarters after steadily trending downward since 2018.
While the two-year price performance seems volatile even in a trailing average illustration that smooths out the weekly noise, it’s because prices have been extremely volatile since 2018.
As Forest2Market CEO Pete Stewart wrote in 4Q2018, “… the irregular [price] peak that occurred from May-August was an anomaly likely driven by speculation around uncertain trade policies, overly optimistic housing start numbers and pinched lumber flows from Canada and the timber-constrained PNW.”
However, when the market dust settled, Stewart added: “Remove the May-August variance, control for a more historical trend and 2018 lumber prices are really in line with historical norms and current demand.”
And this is what we’re seeing in the trailing average data as well. The obvious price decrease appears to be an extreme correction that suggests market challenges at the structural level. However, this price change represents a natural return to equilibrium as market speculation waned in 3Q2018.
As we well know, the US housing market is cyclical—if not fickle—by nature, and any commodity that is dependent on such a market will therefore experience volatility related to its cycles. Lumber manufacturers are accustomed to operating in such an environment.
SYP lumber prices now appear to be in a holding pattern based on a more conventional supply/demand relationship, where they should remain in the near term. The upside for mill operators is that lower manufacturing costs in new and upgraded facilities allow producers to efficiently manufacture SYP lumber through market valleys, speculative bubbles and anomalies like COVID-19 that impact global markets.
This trend, combined with favorable cost structures, will allow southern producers to continue gaining market share in an increasingly competitive global lumber trade.